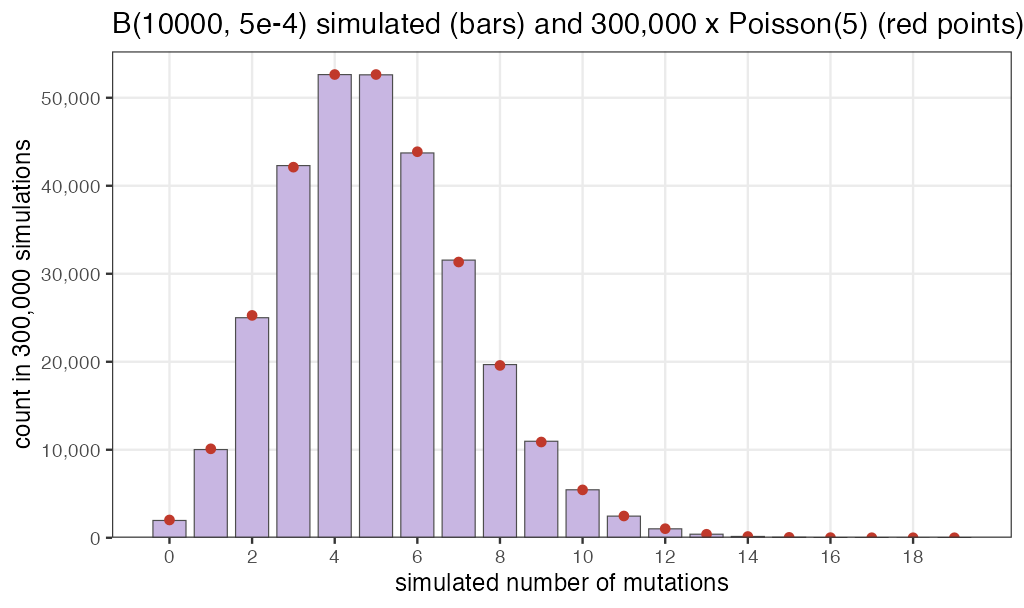
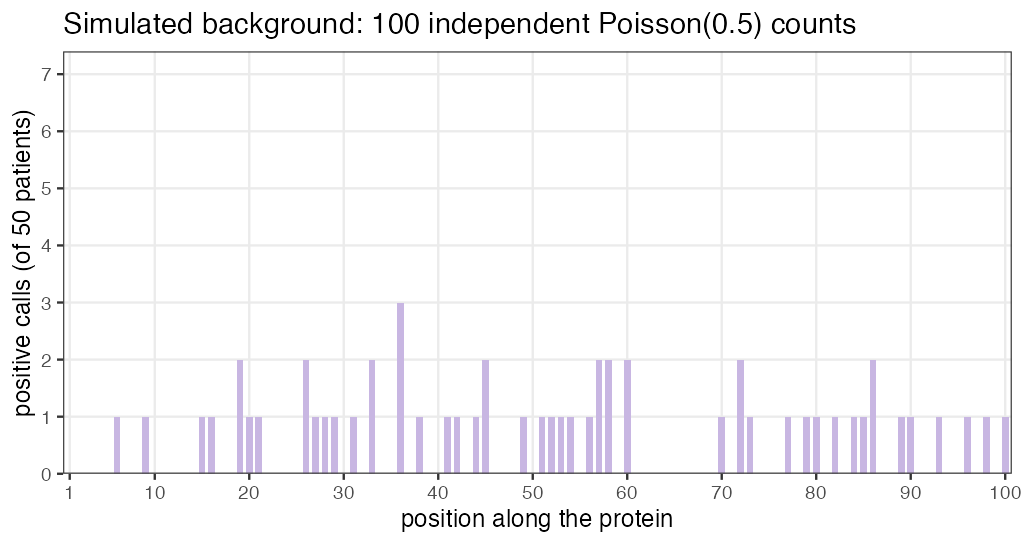
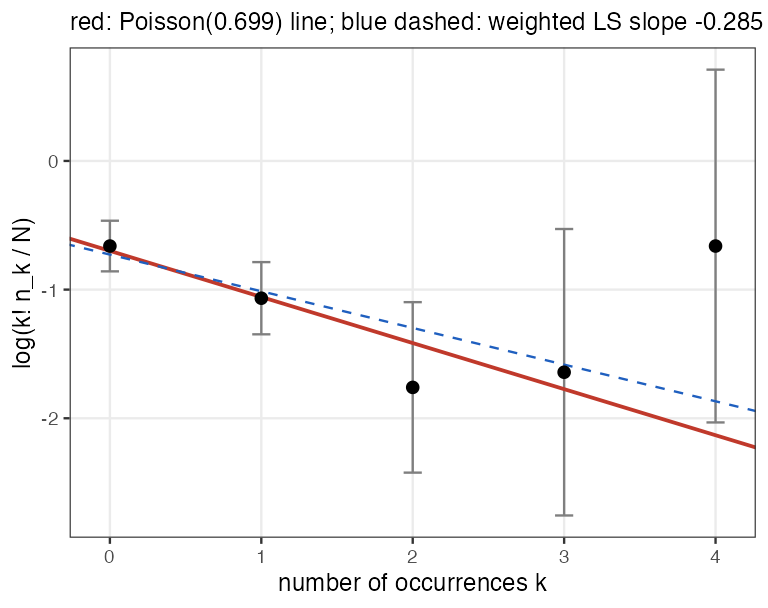
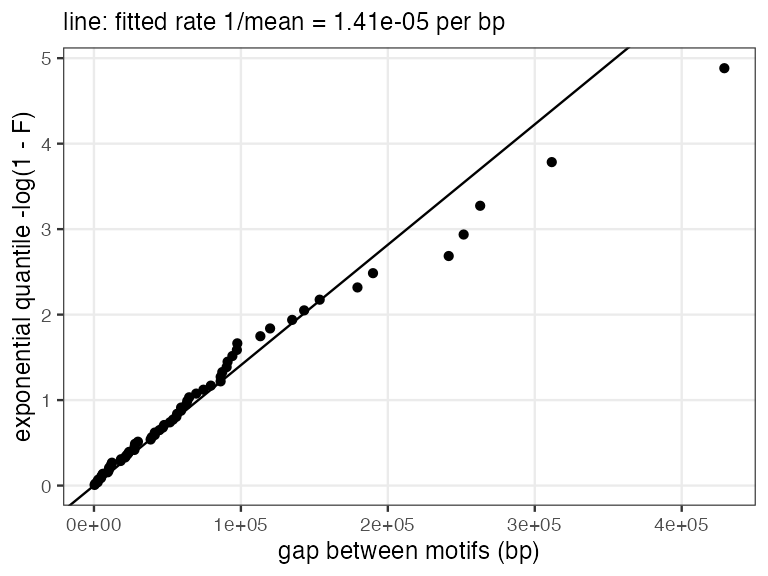
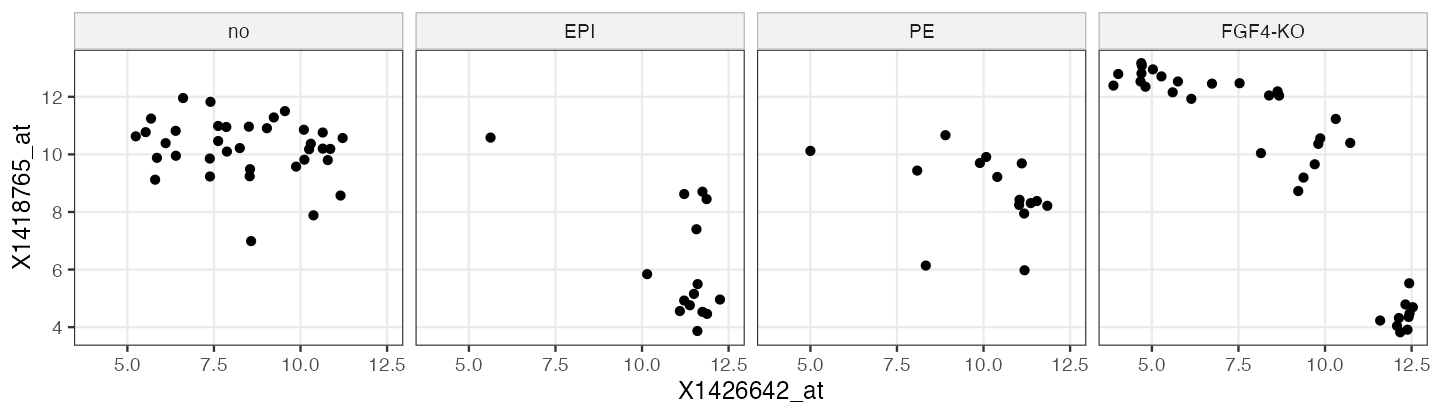
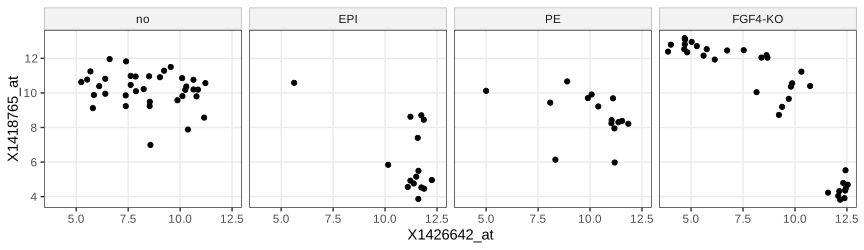
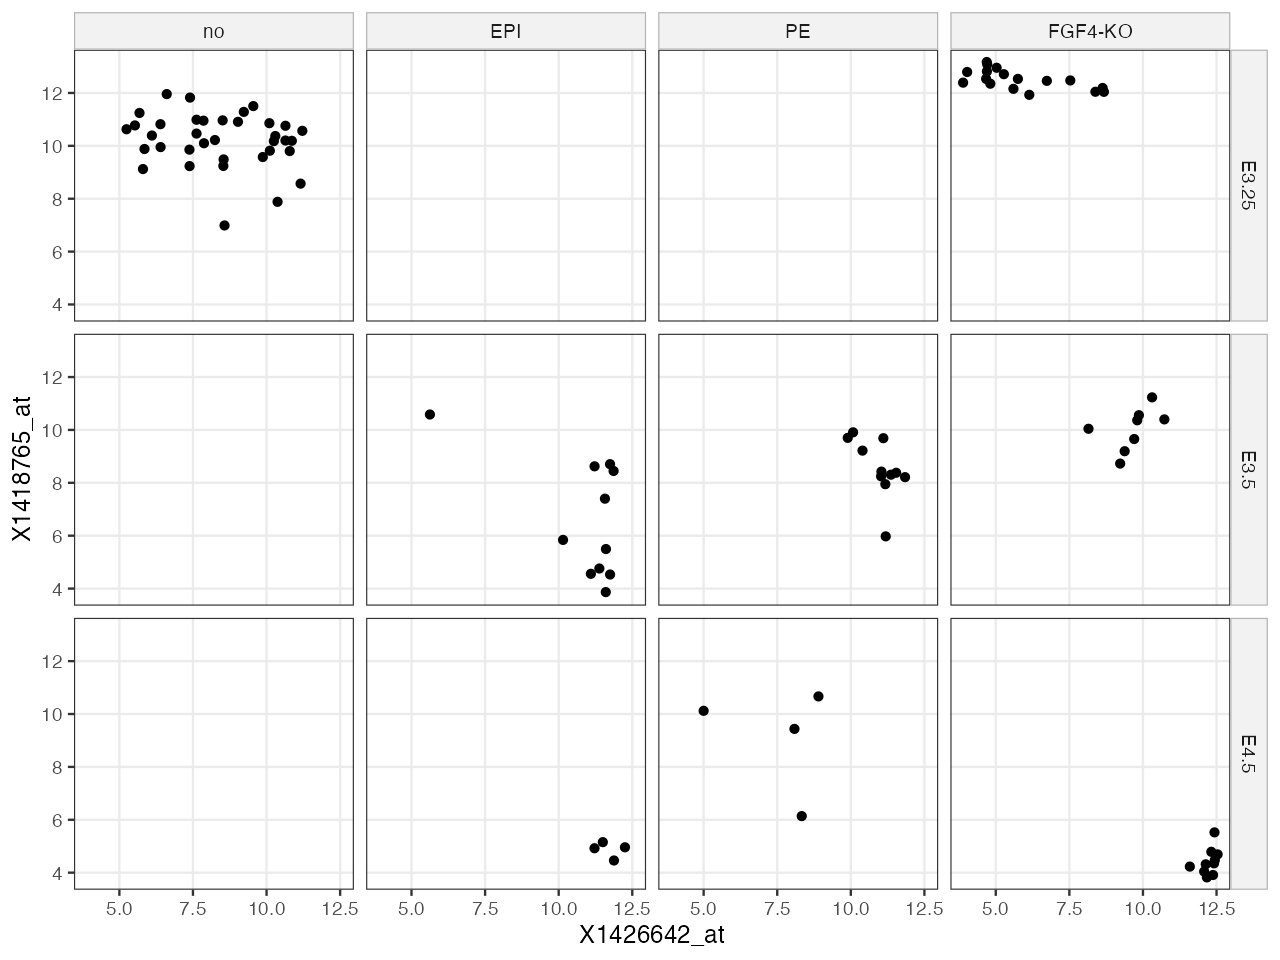
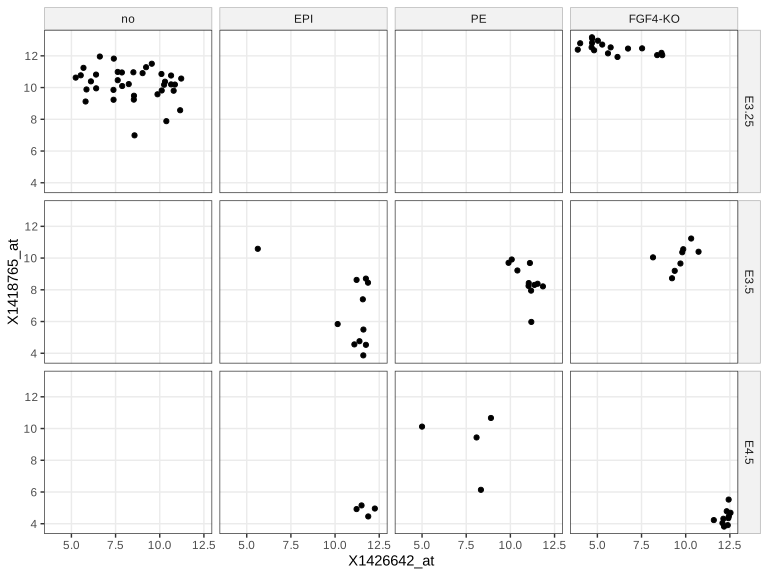
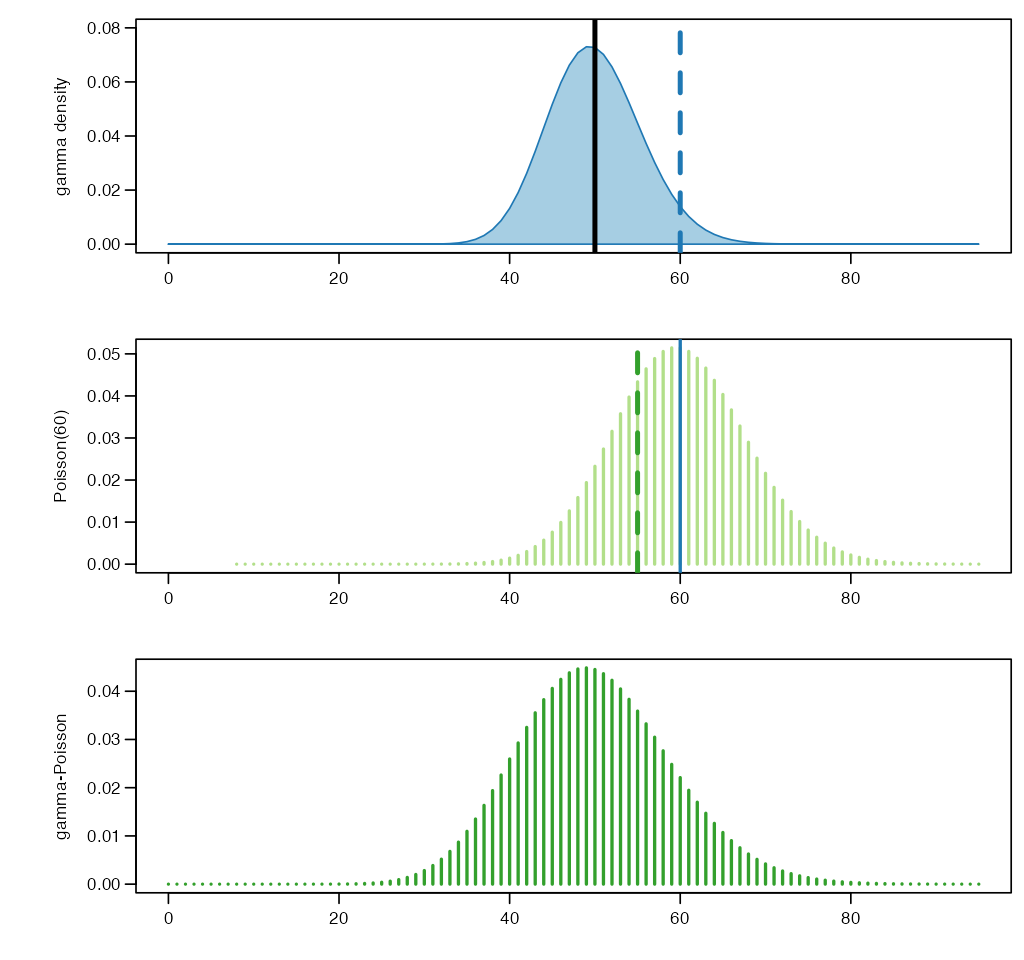
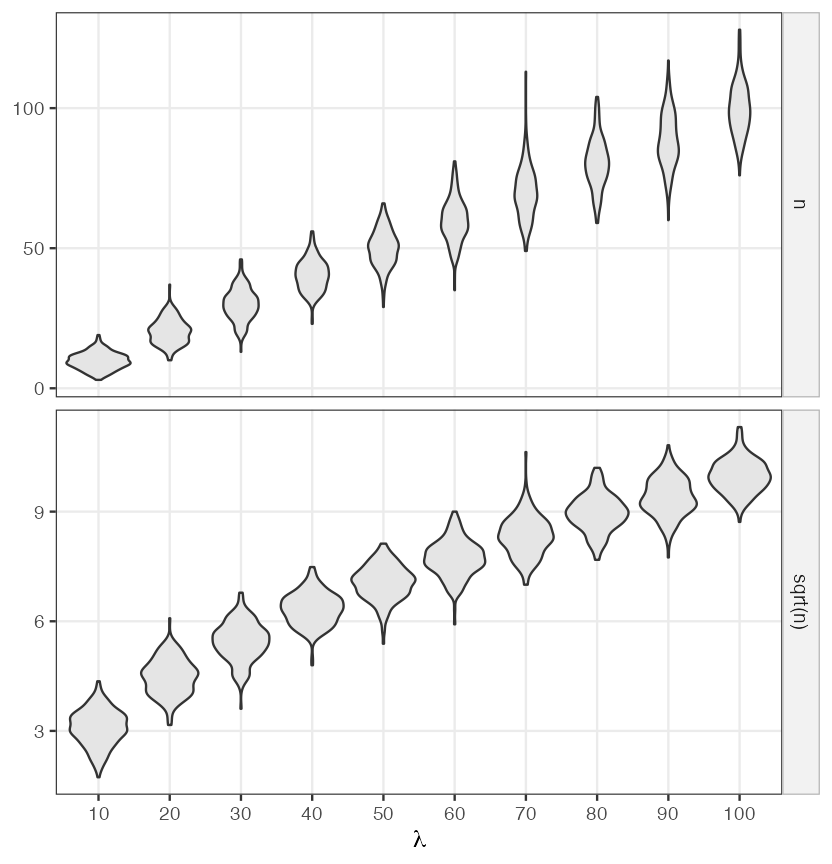
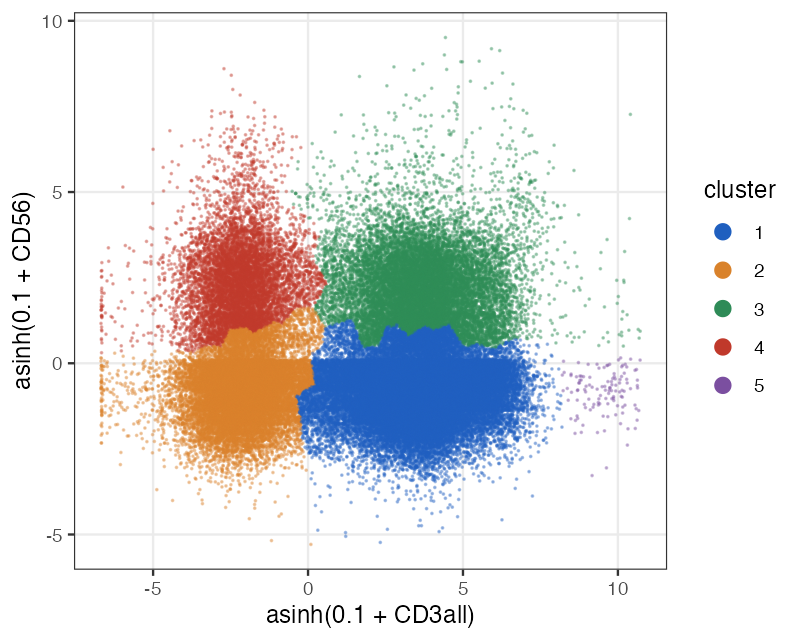
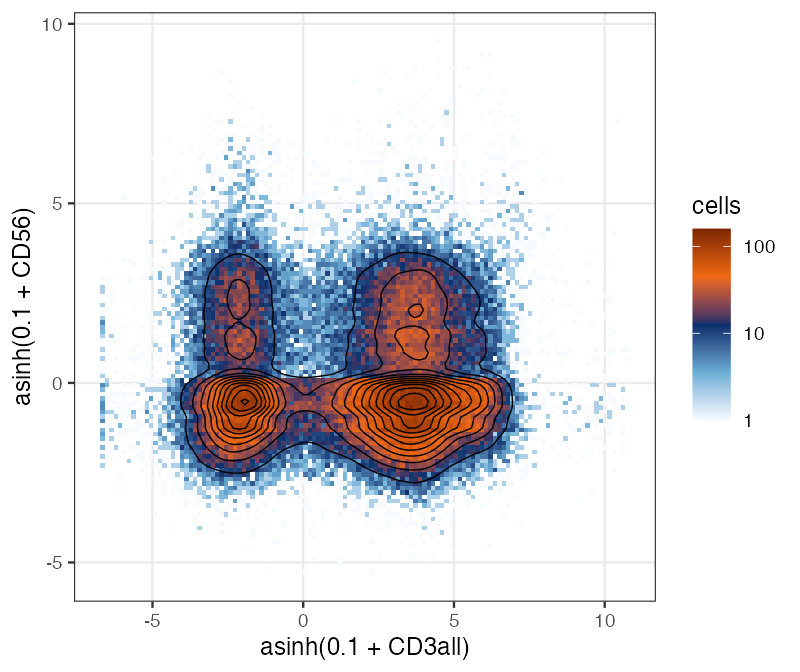
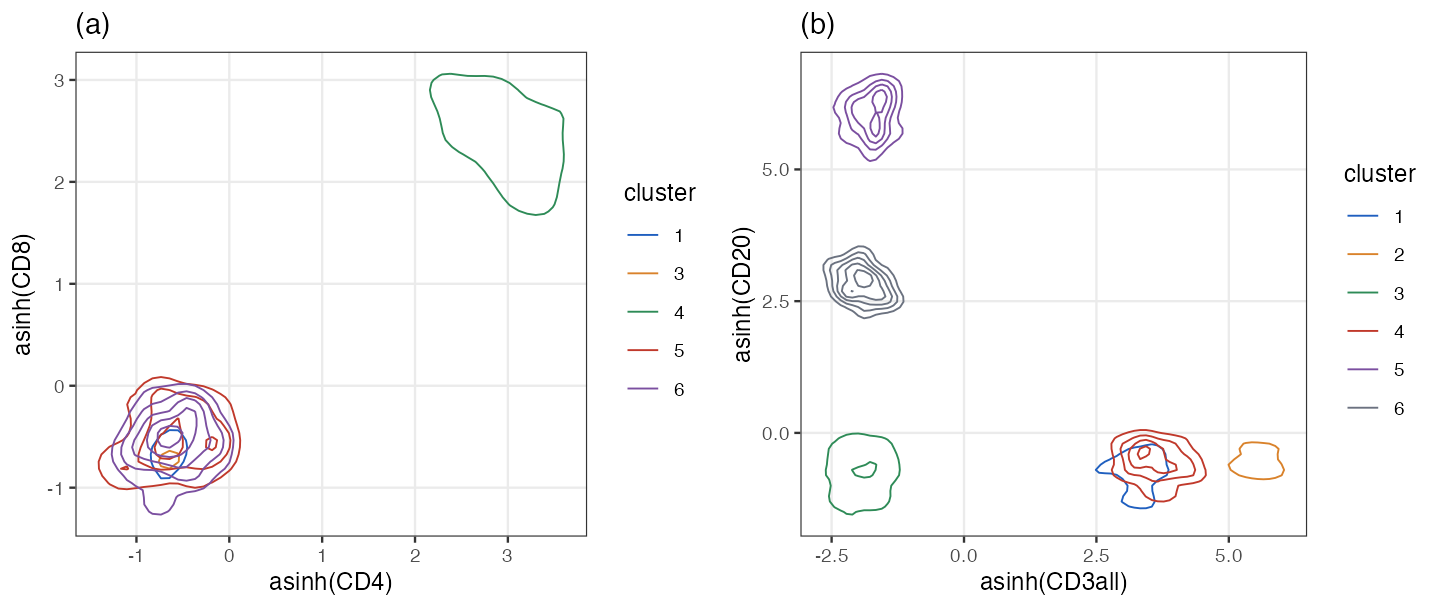
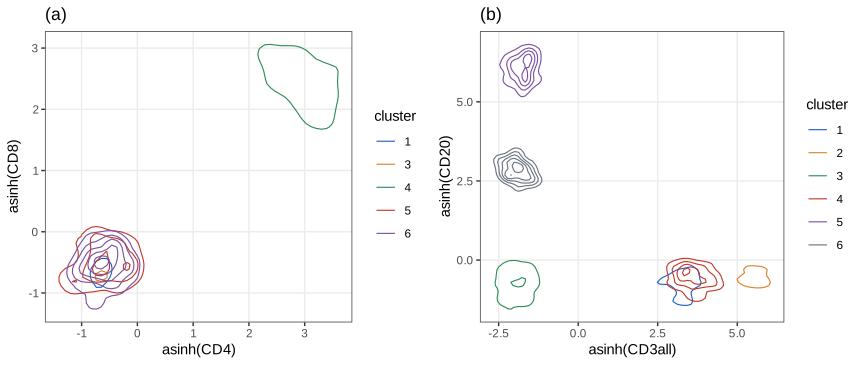
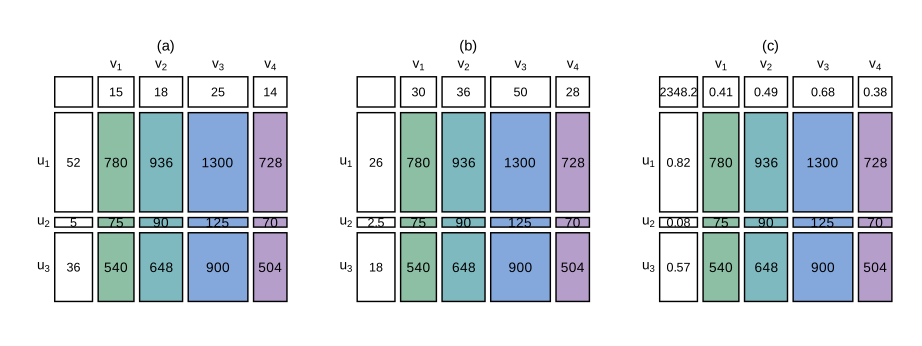
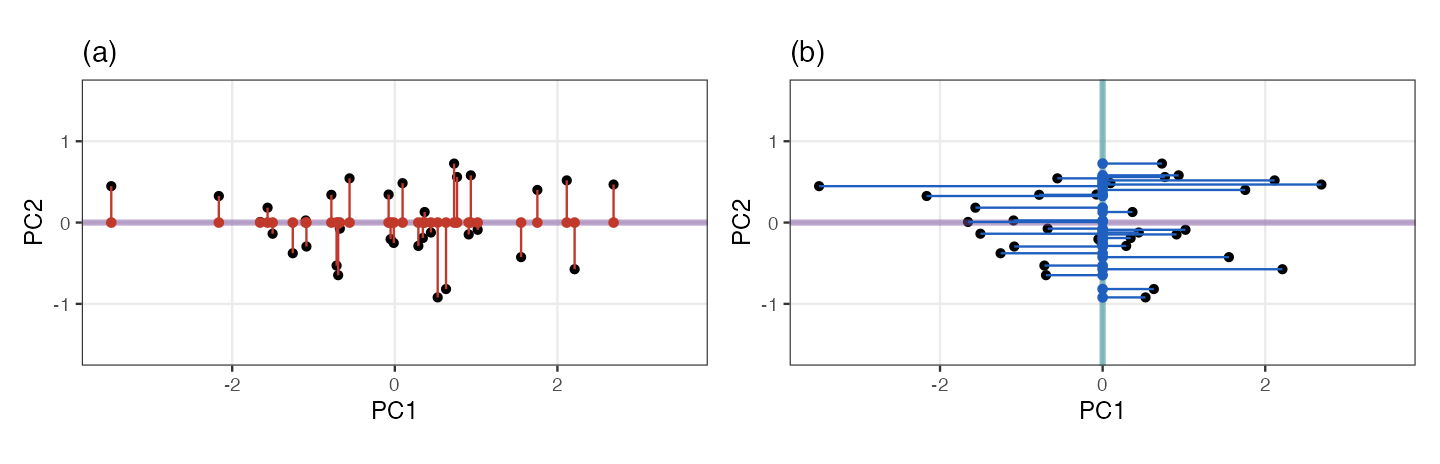
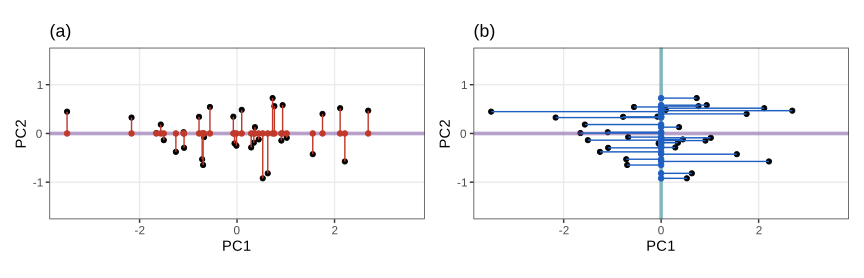
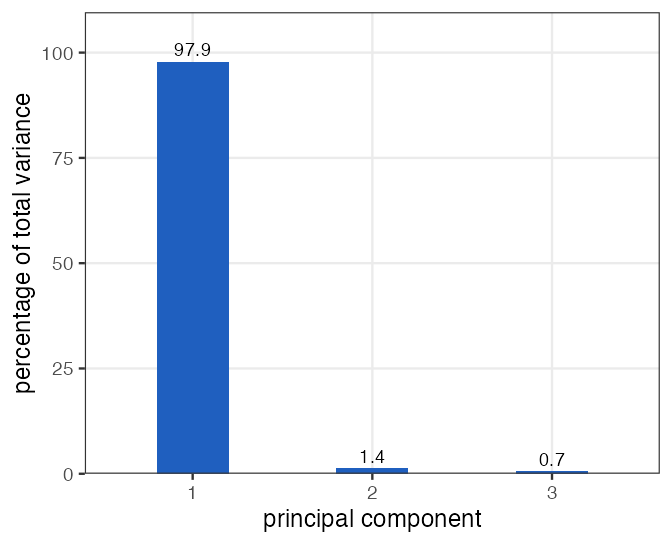
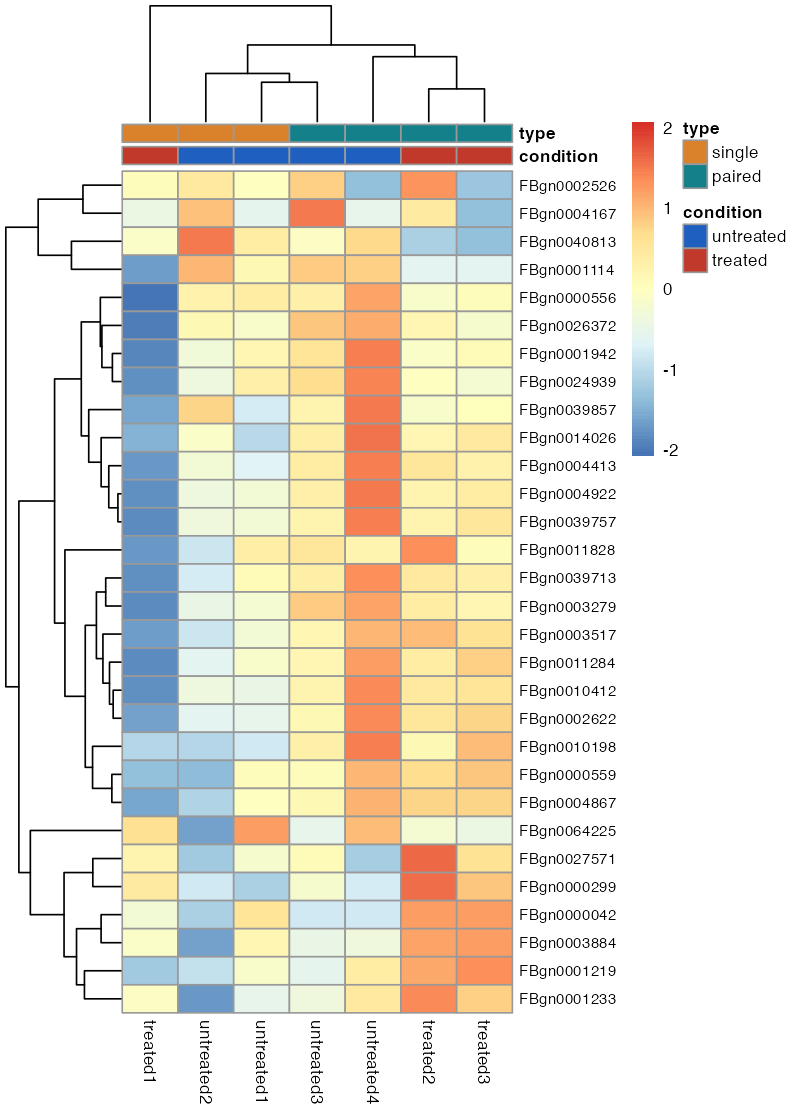
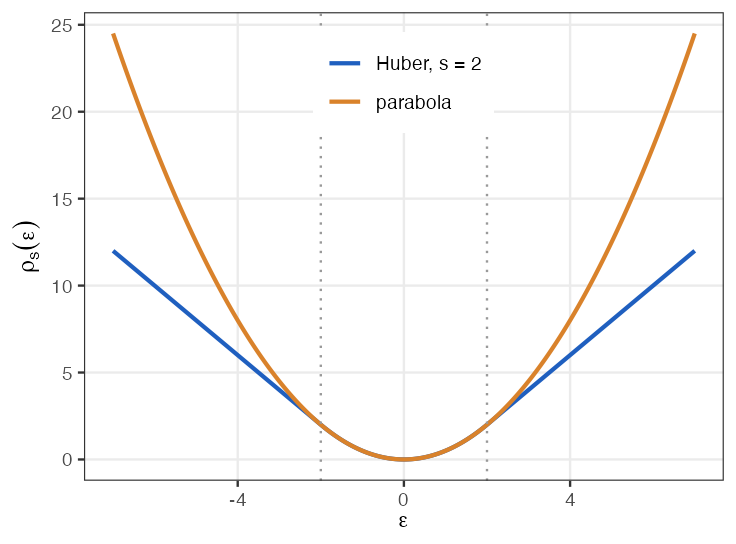
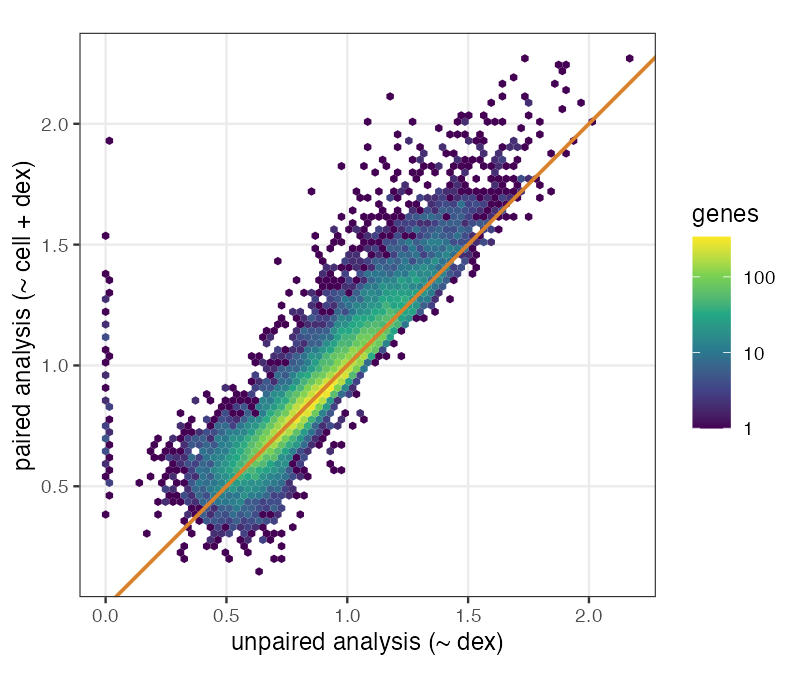
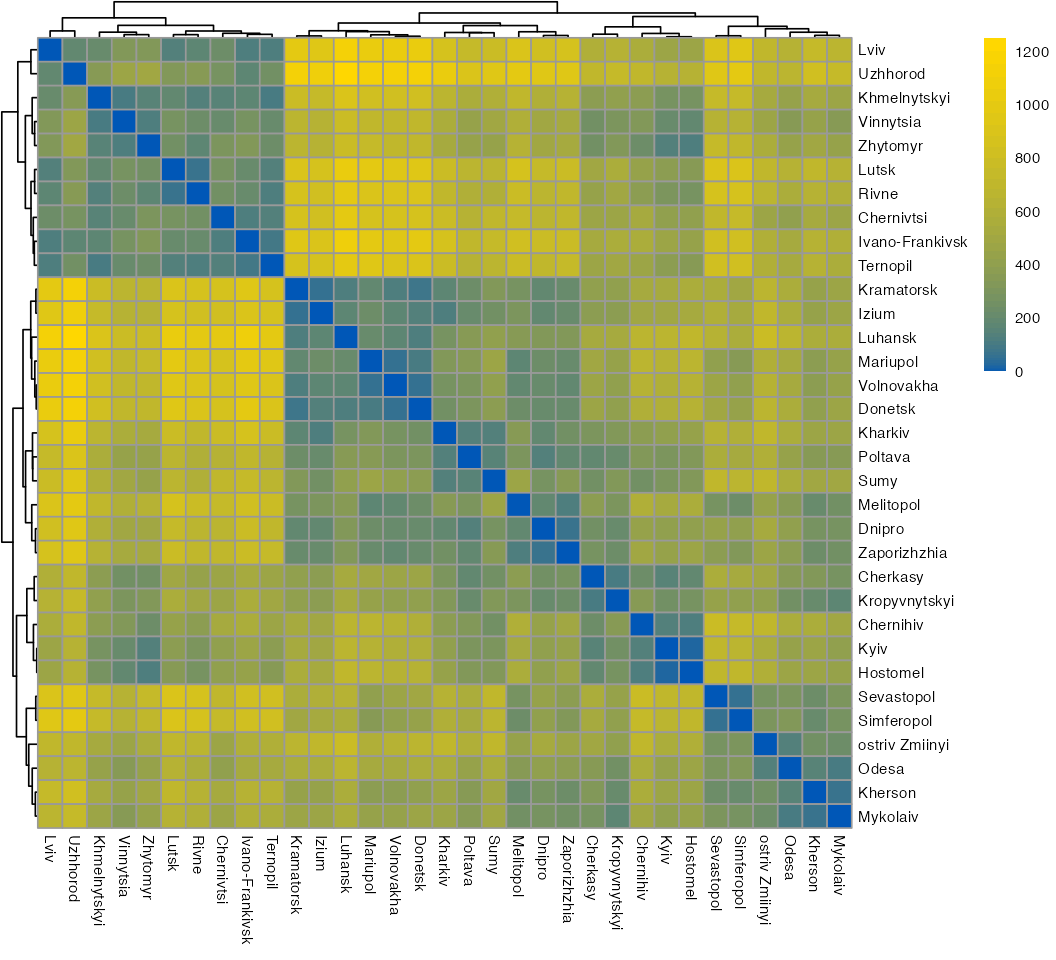
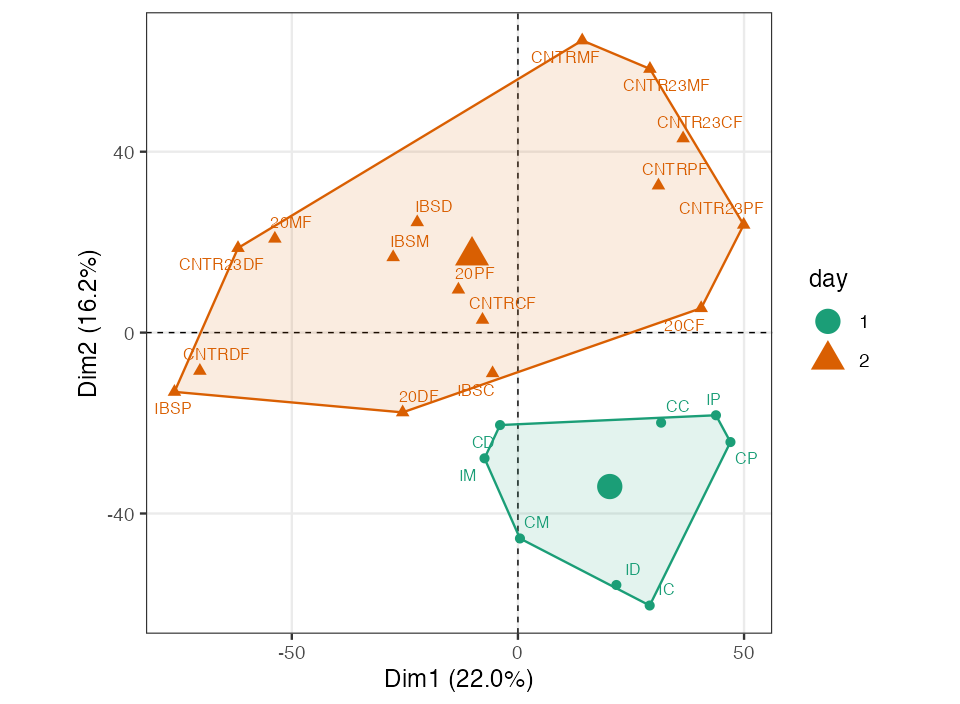
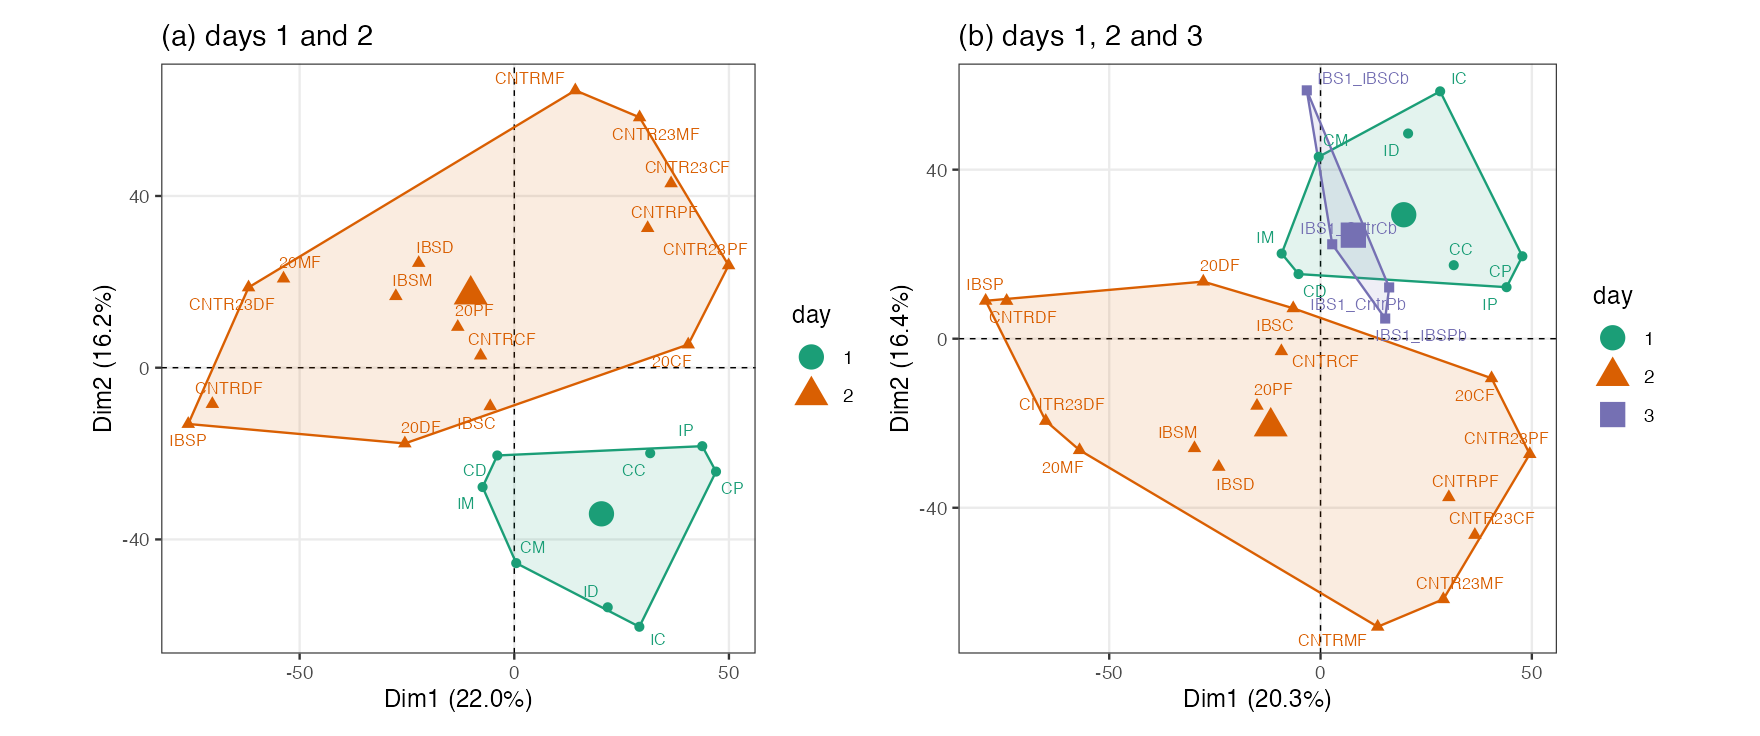
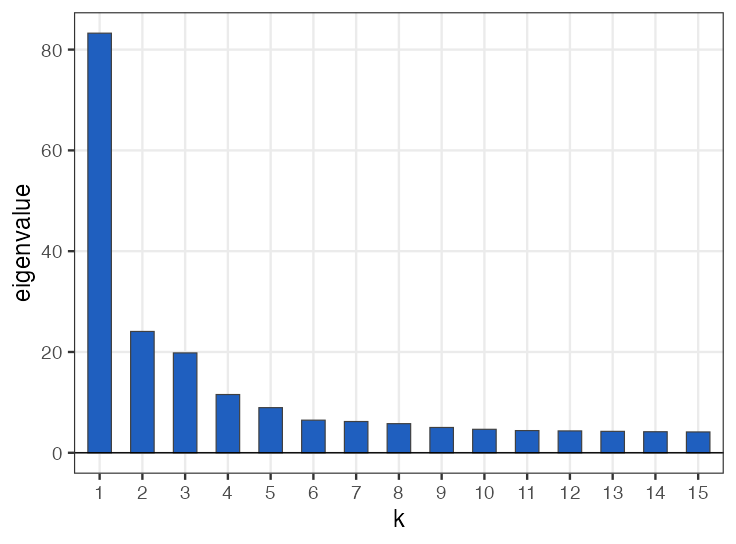
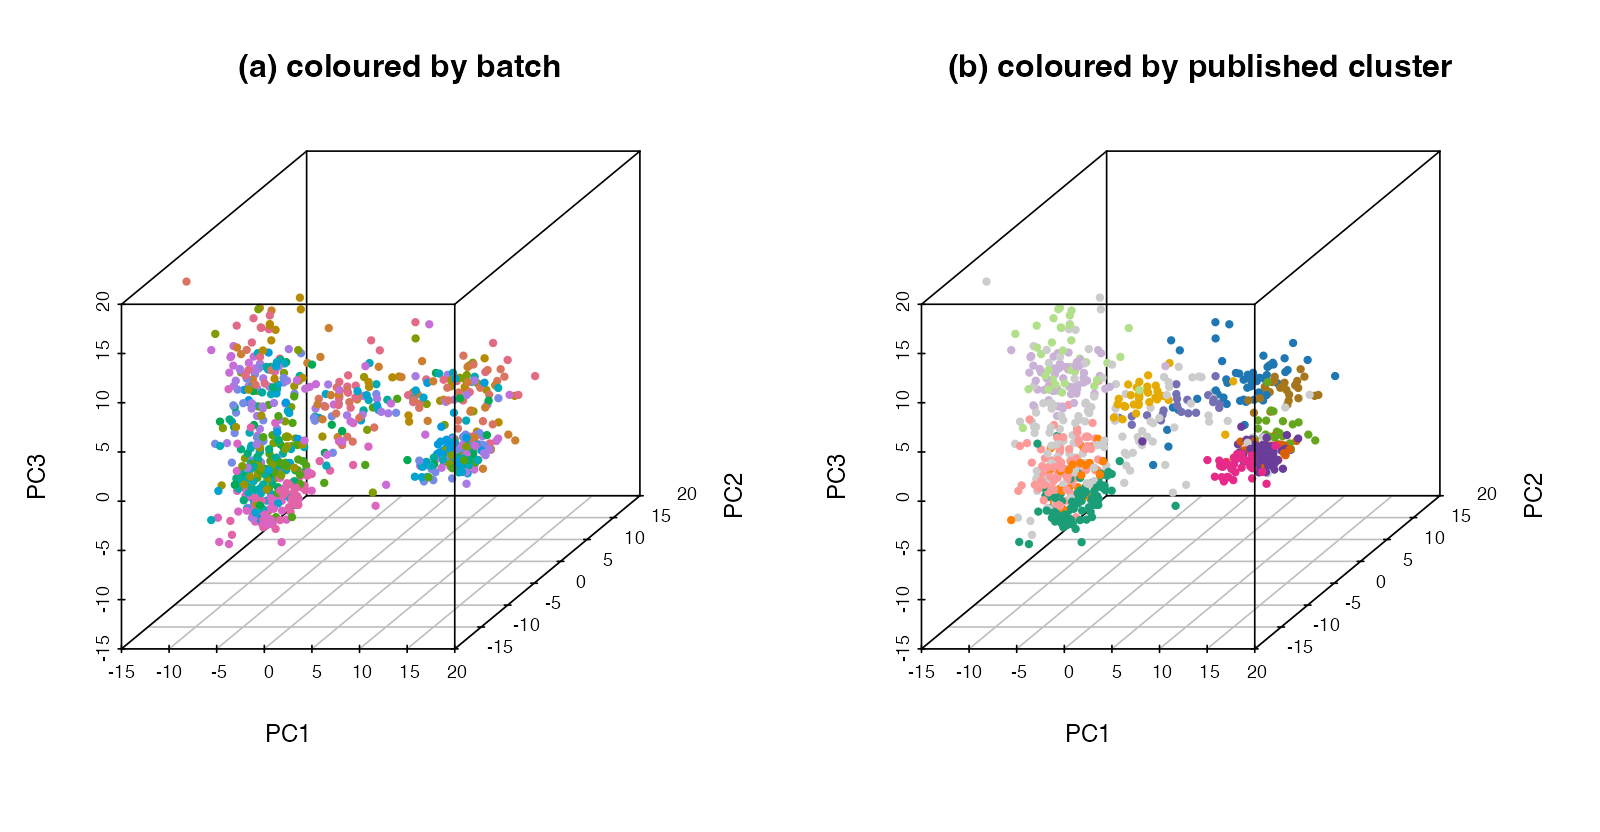
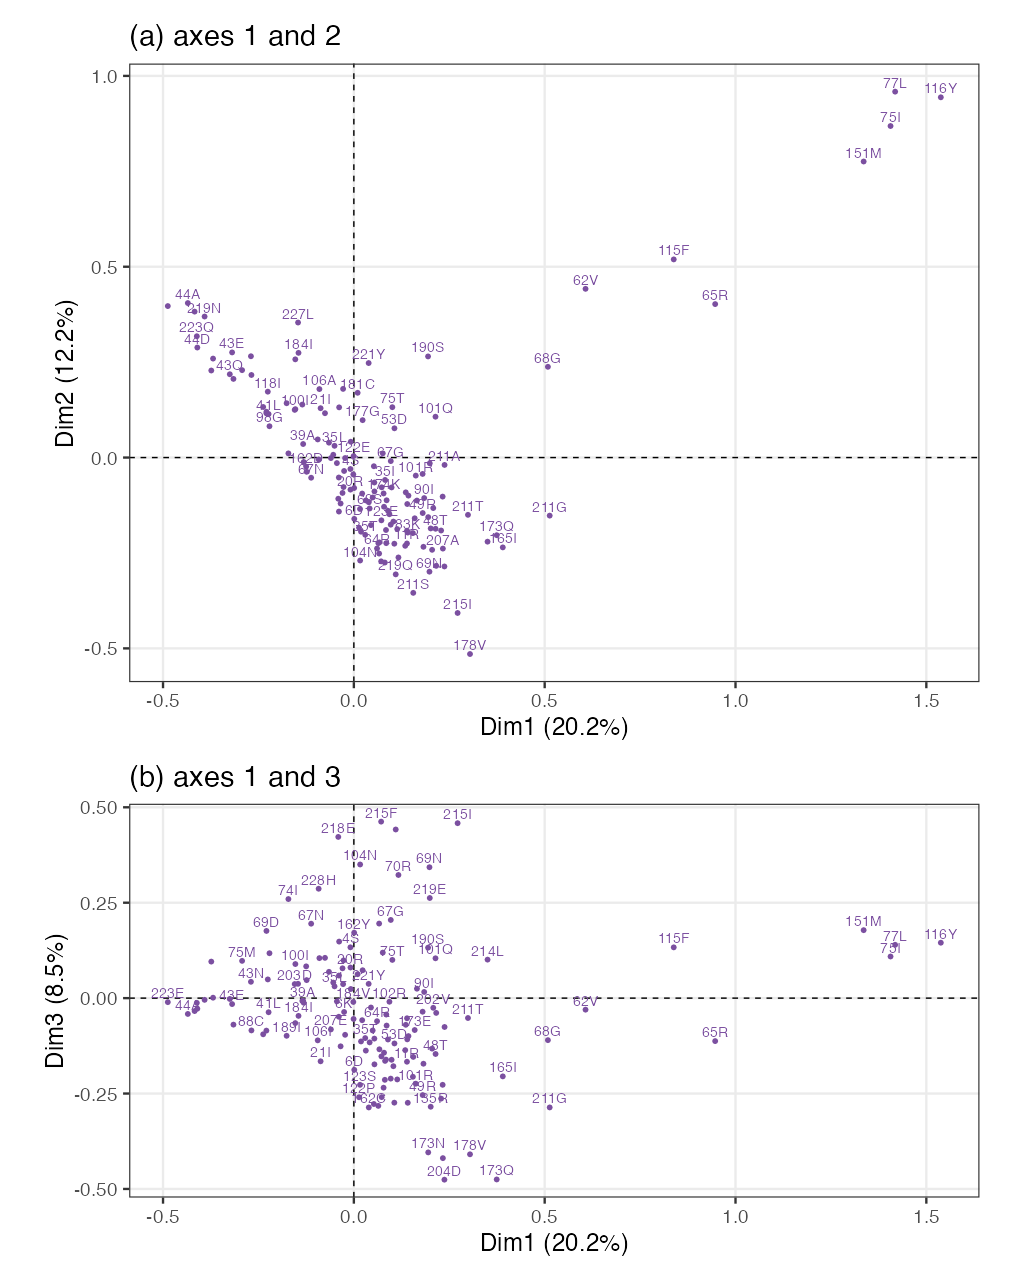
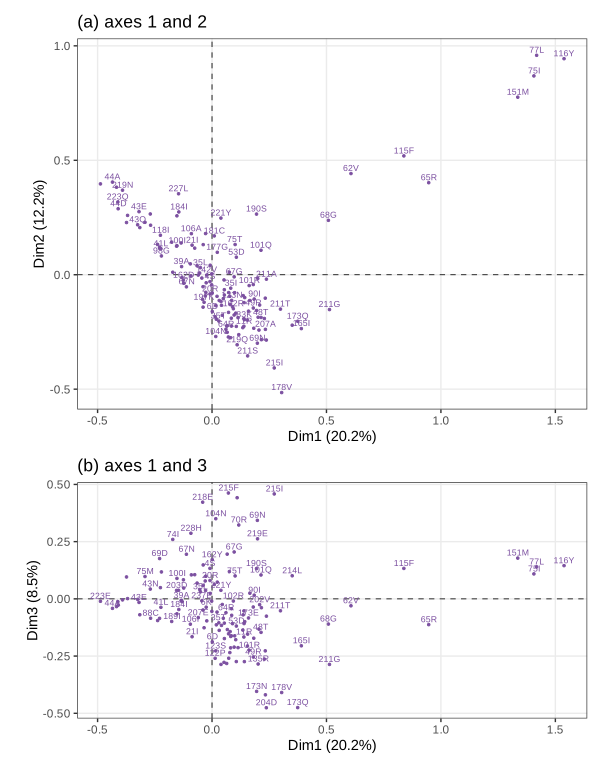
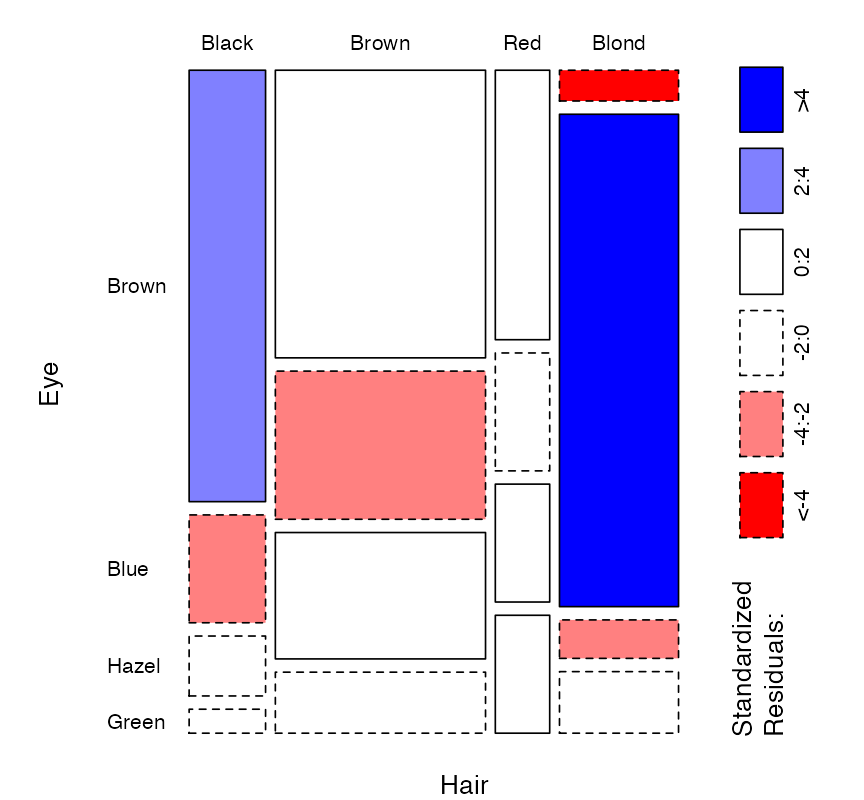
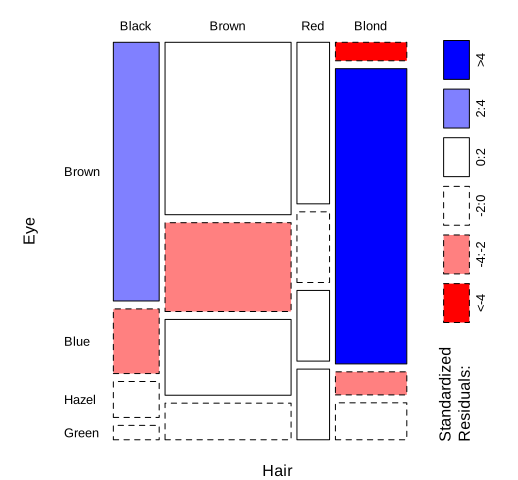
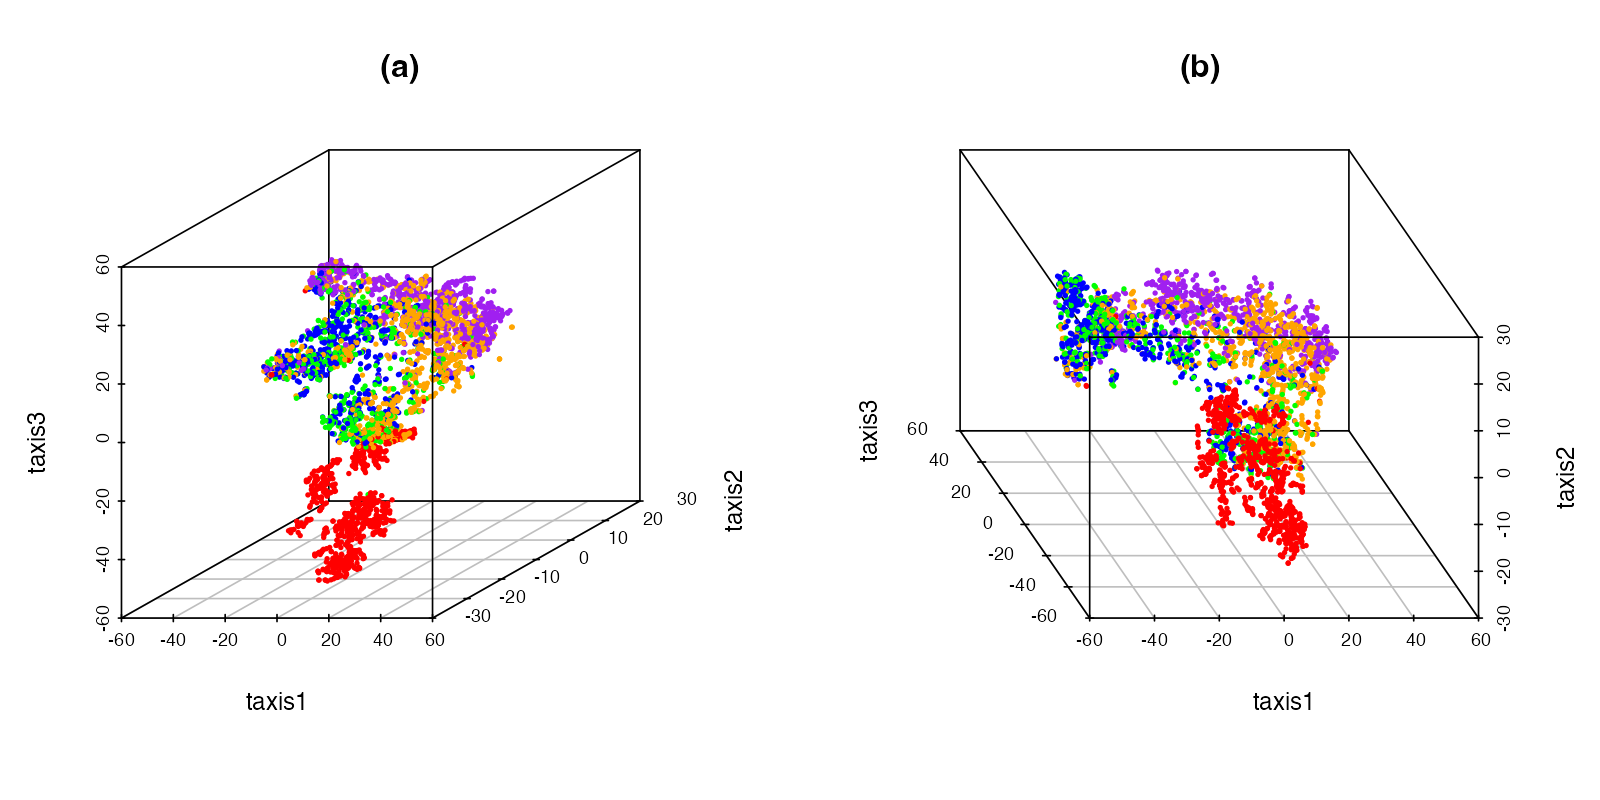
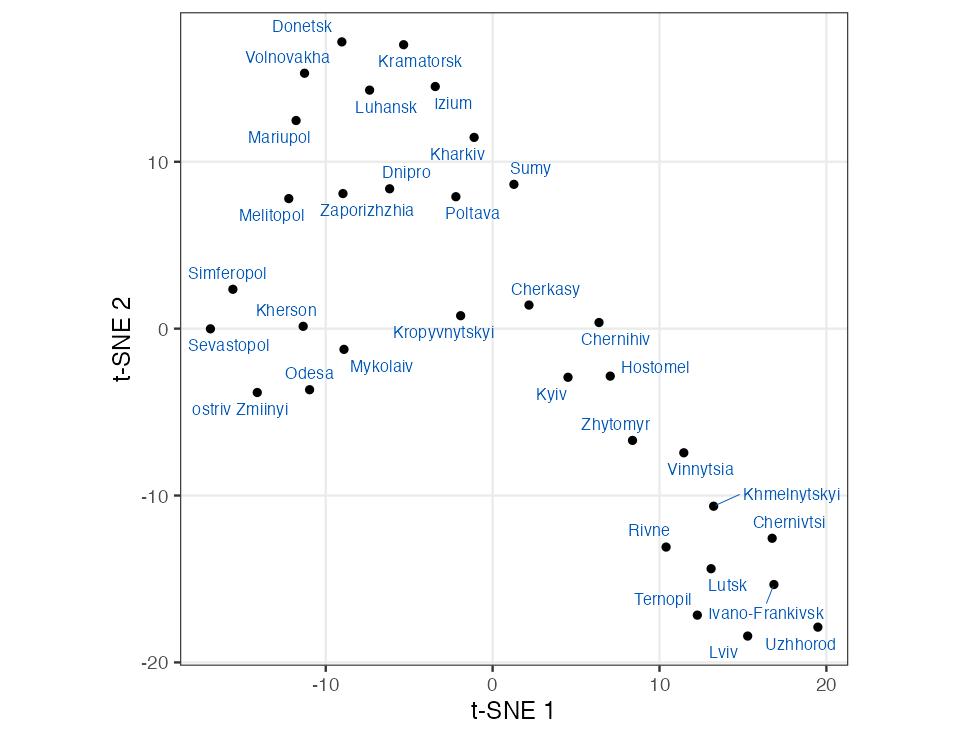
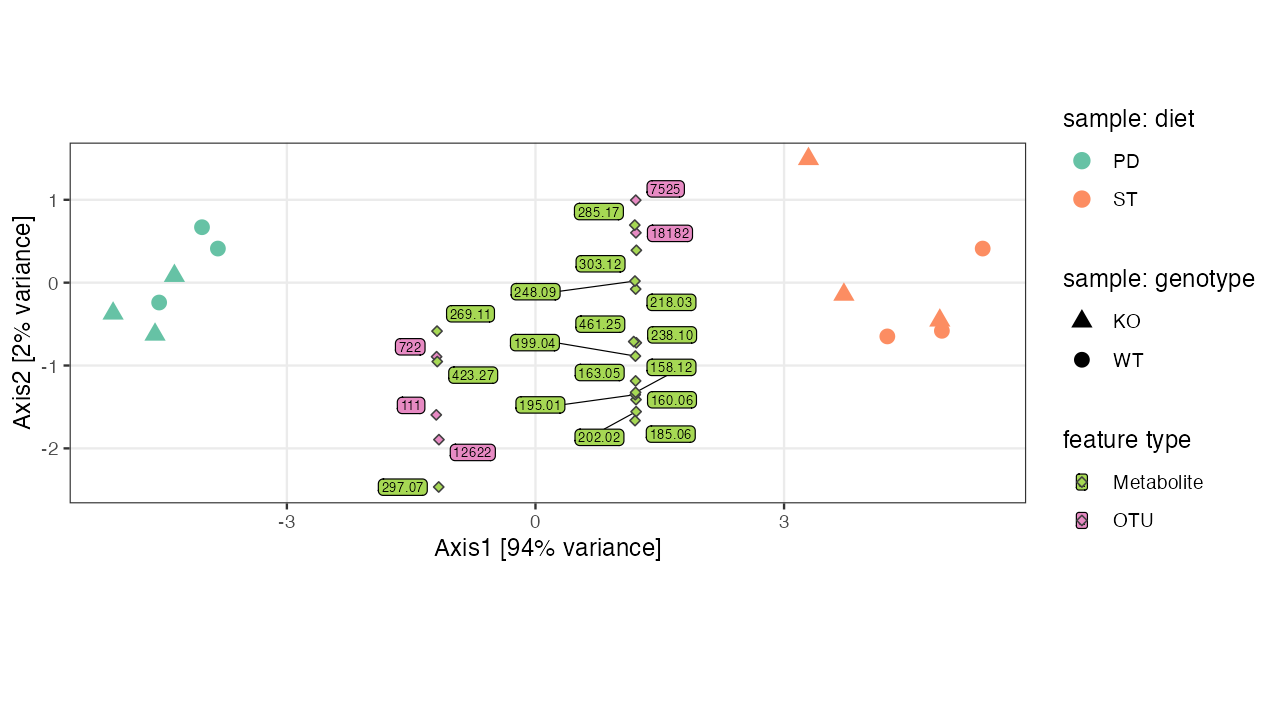
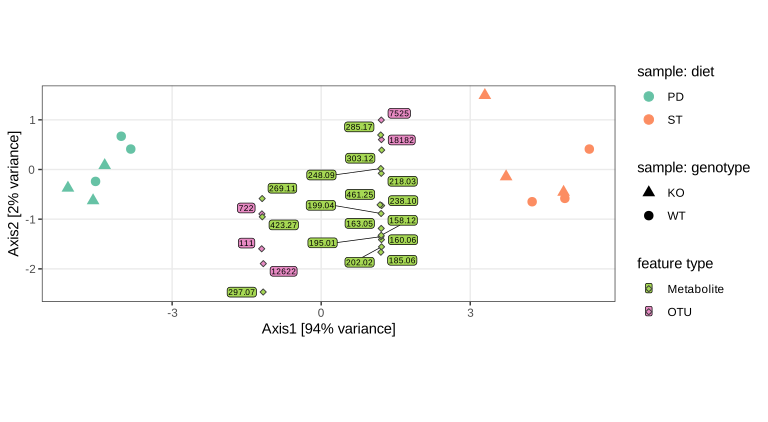
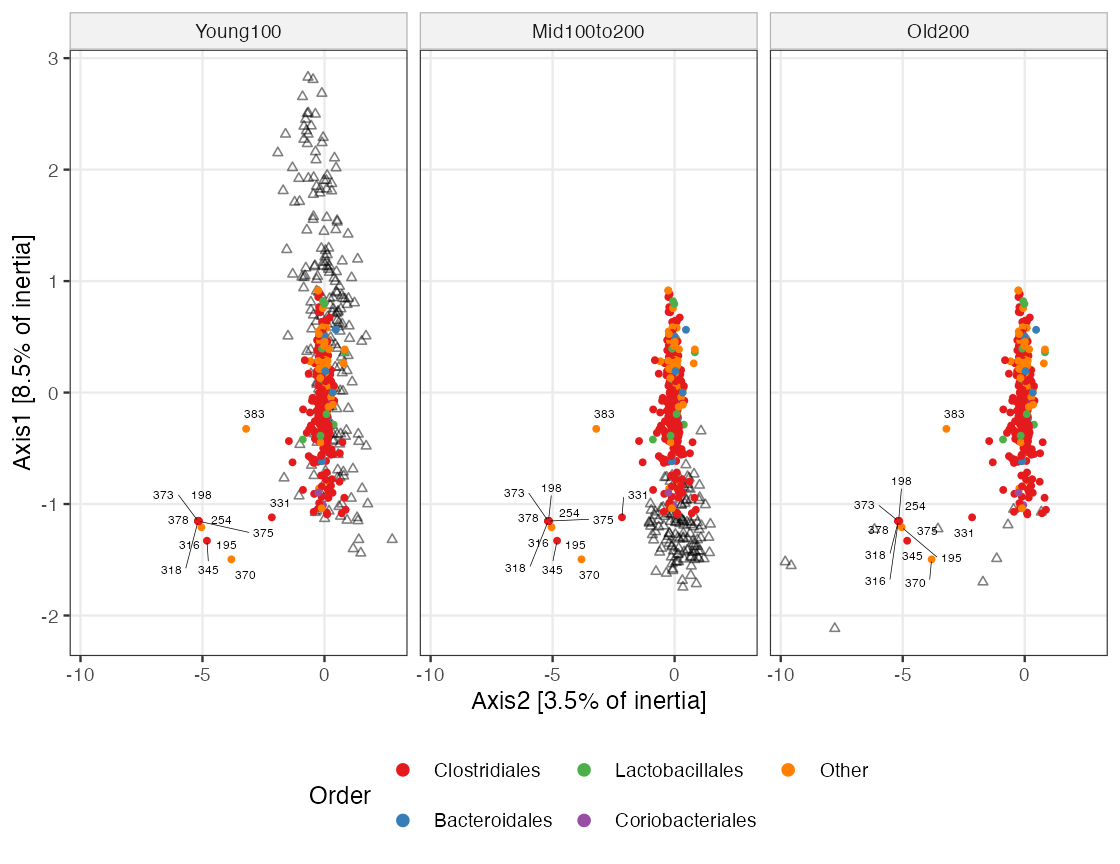
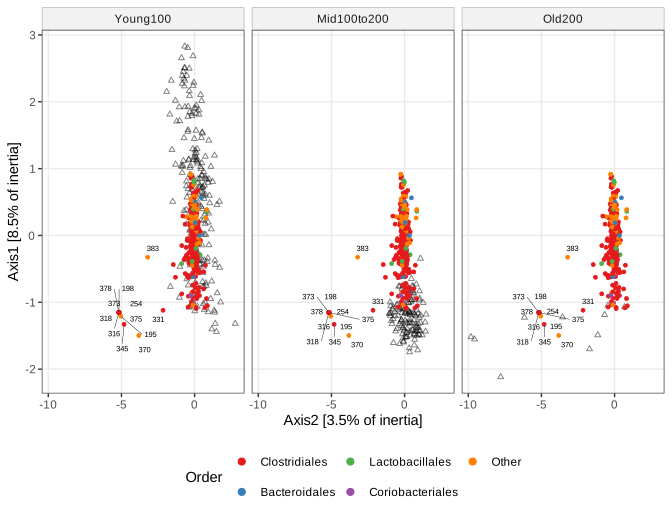
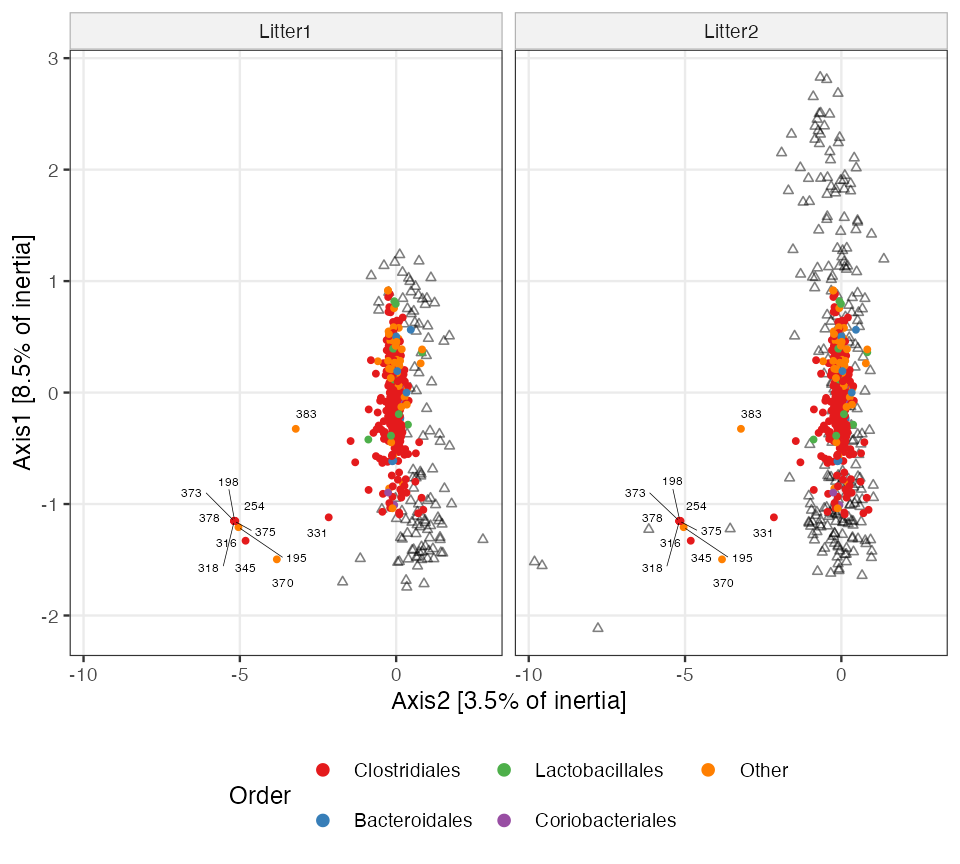
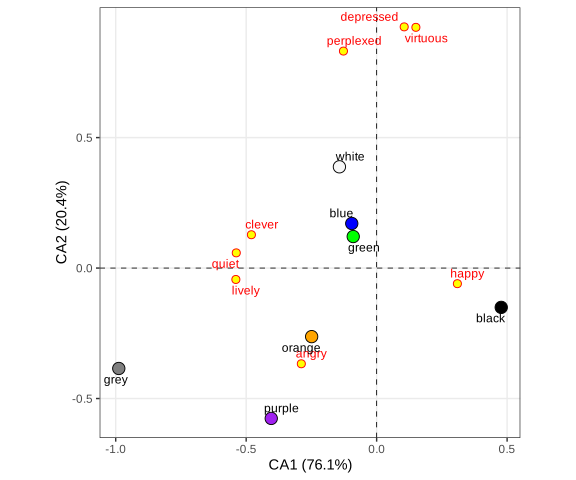
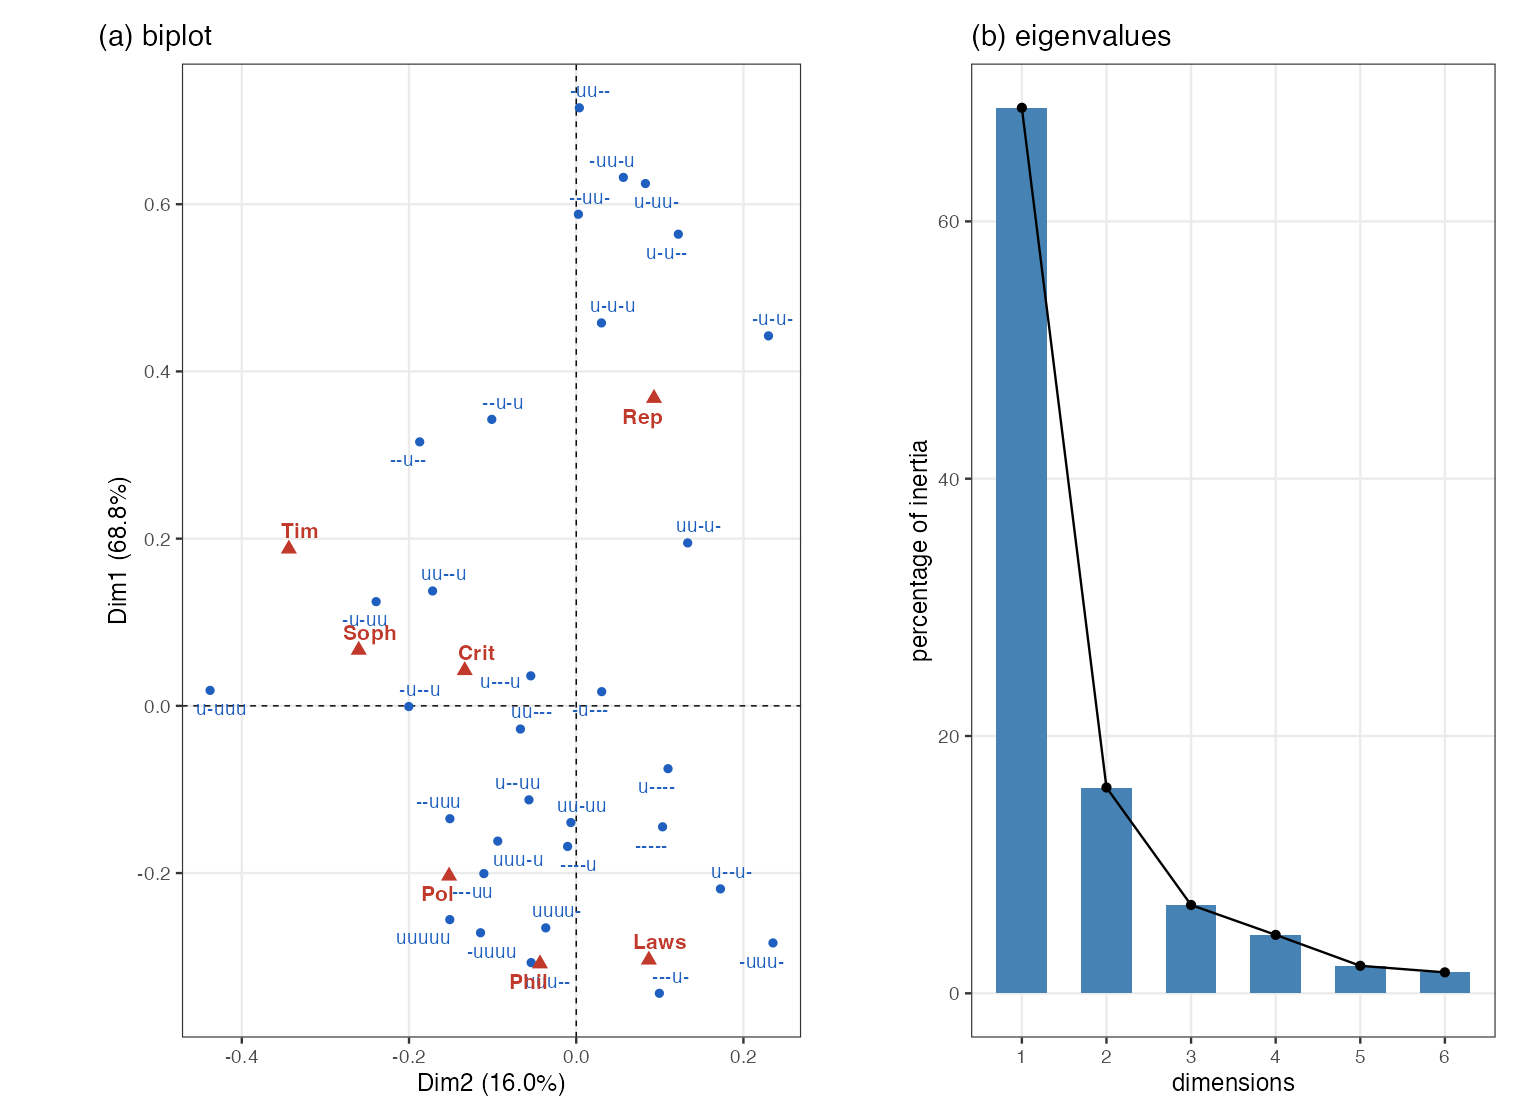
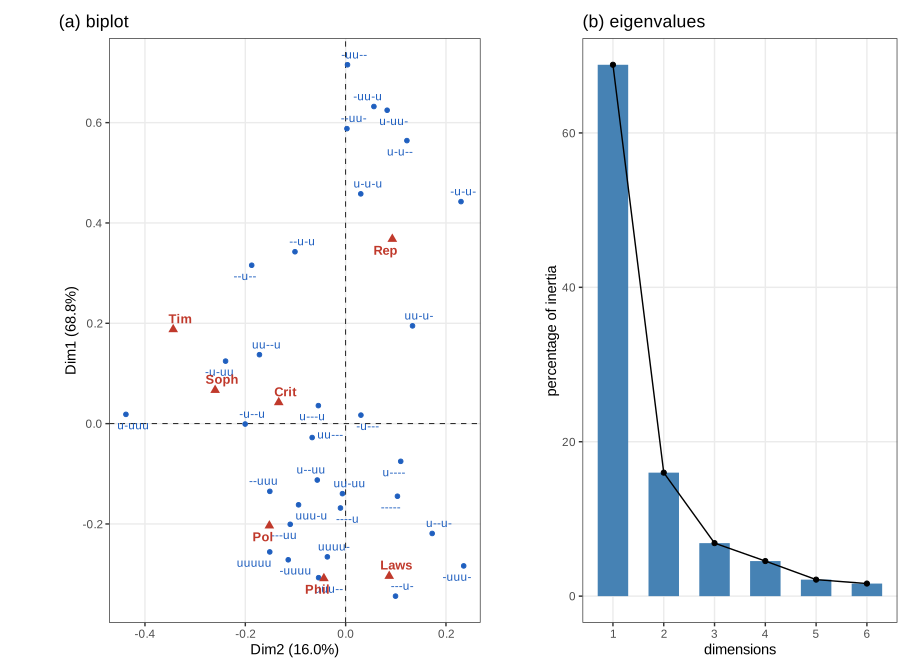
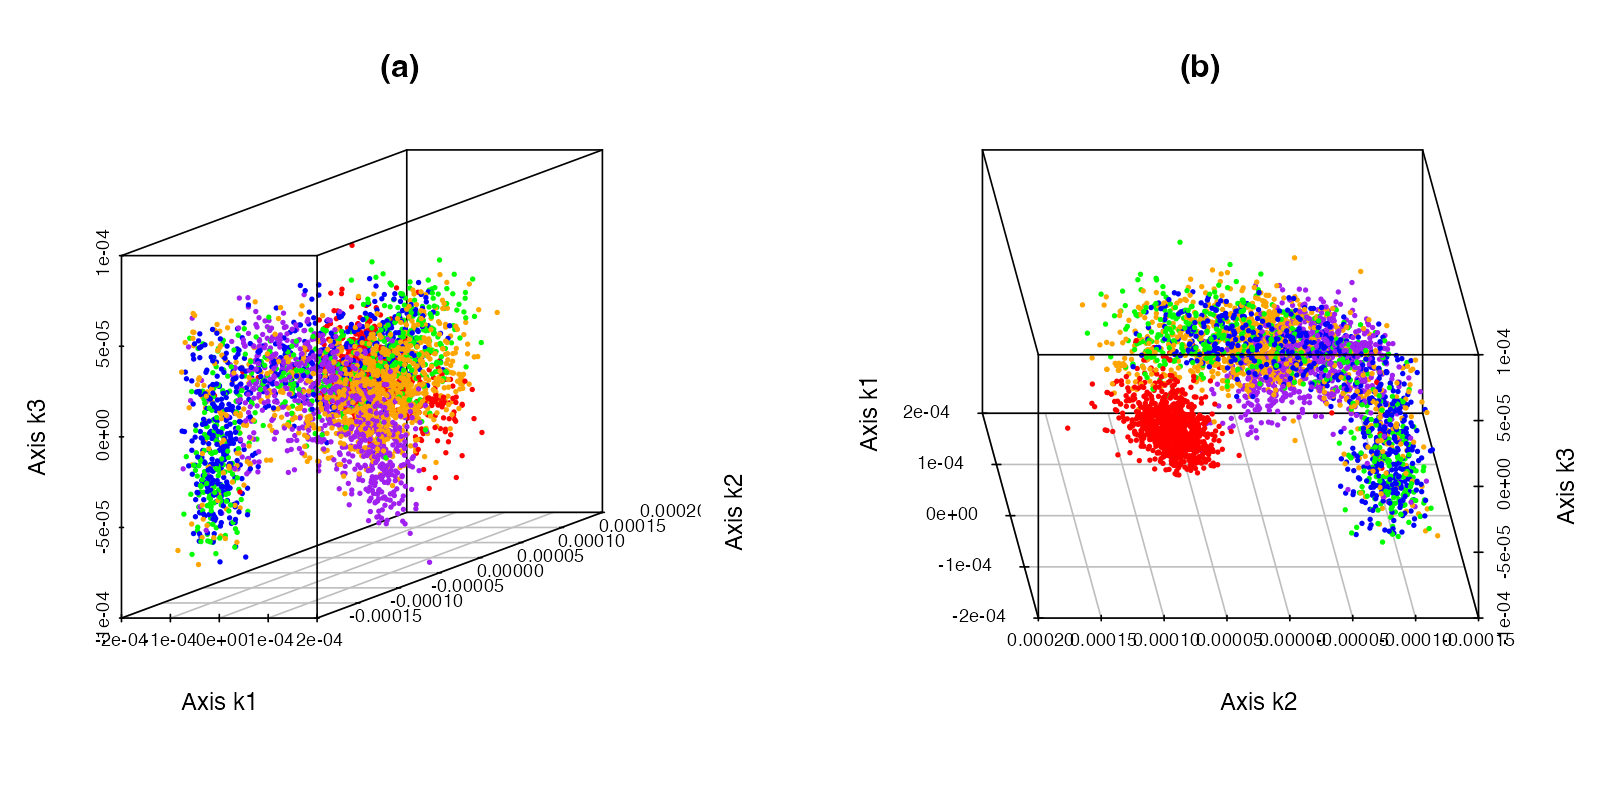
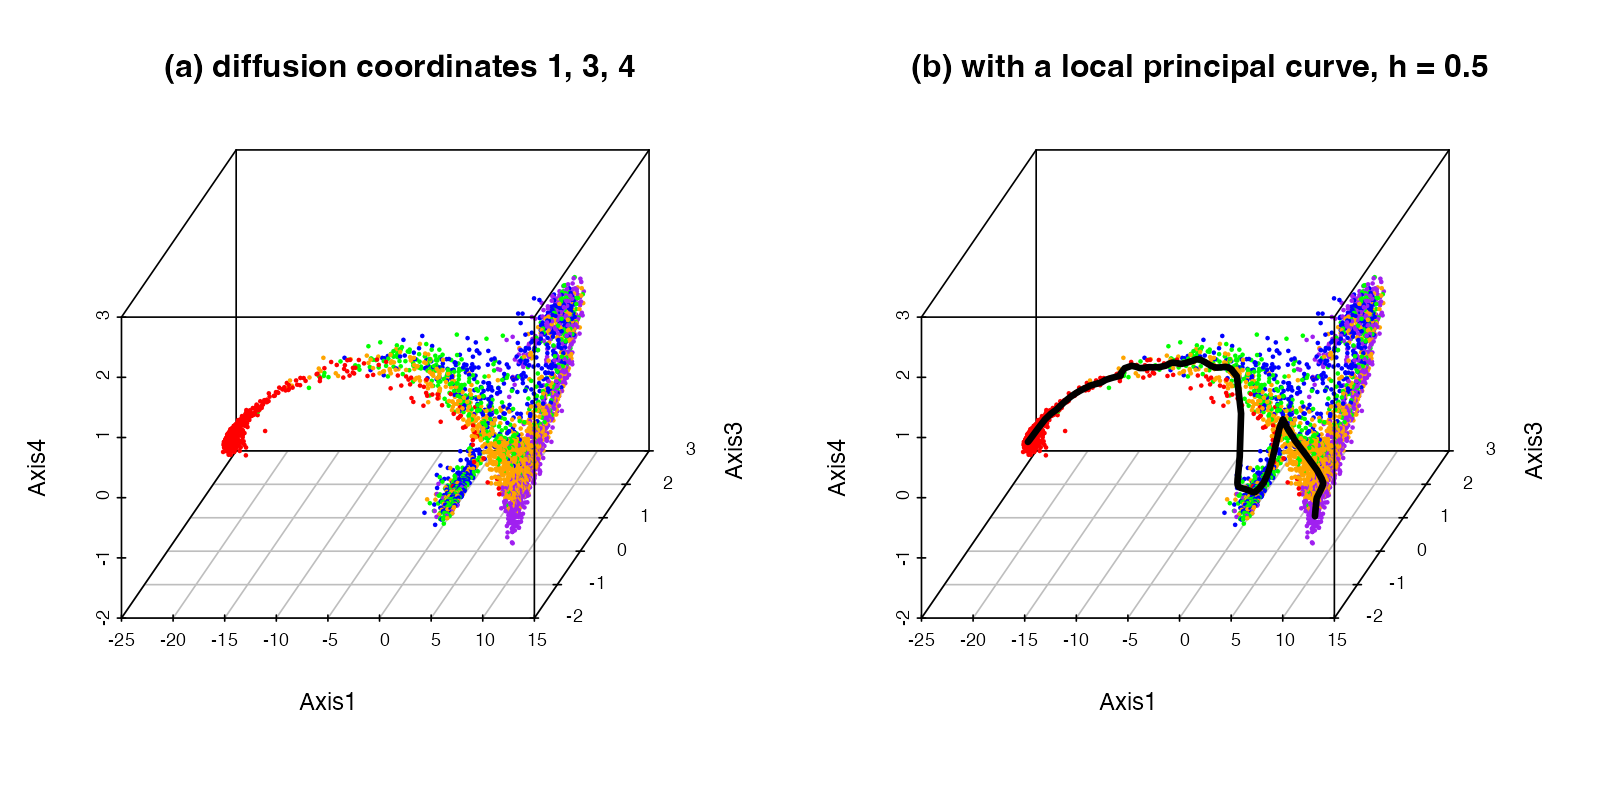
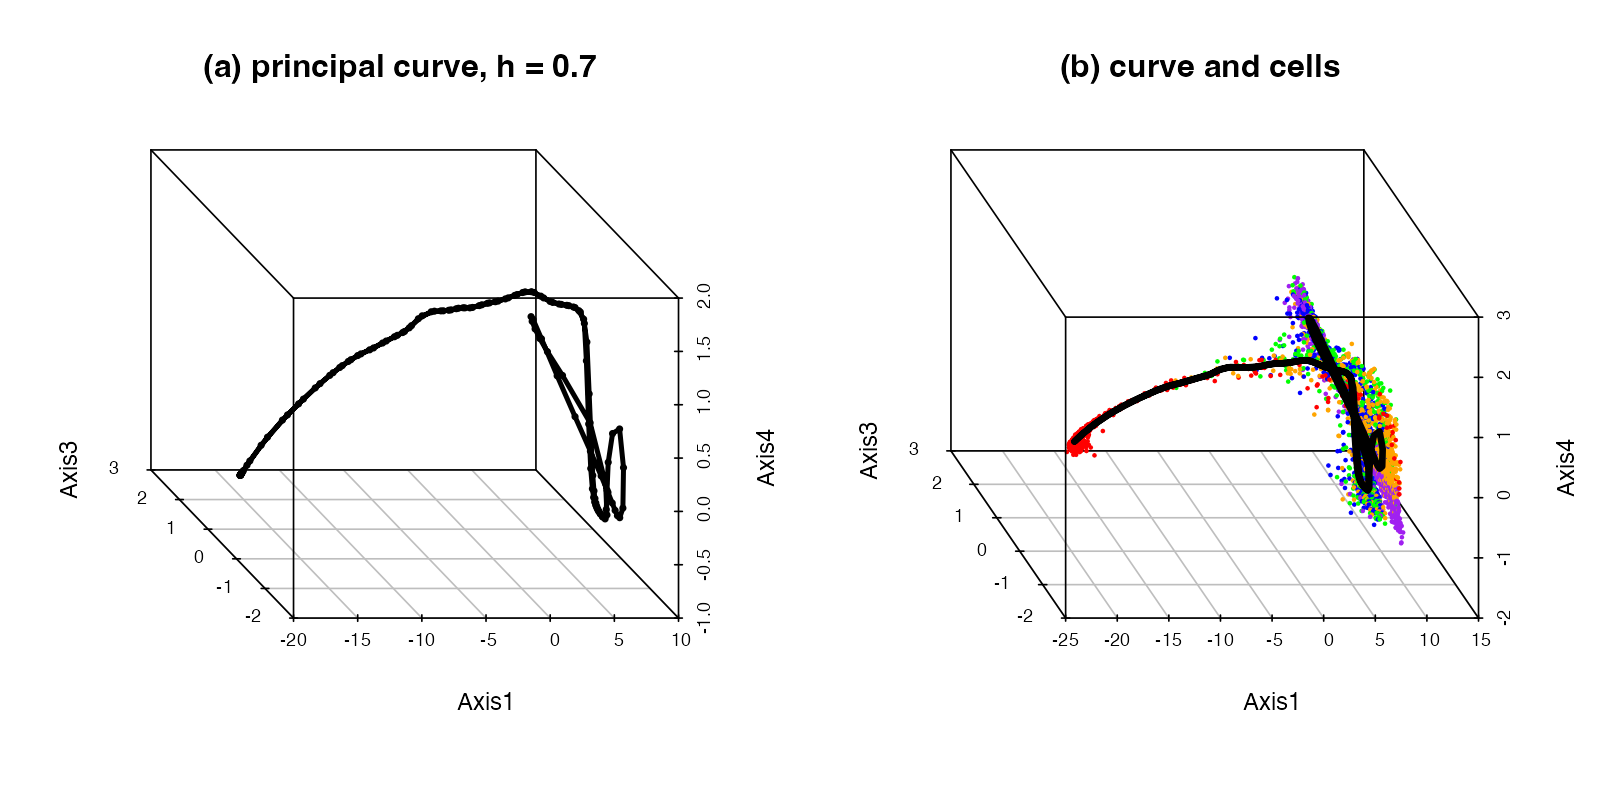
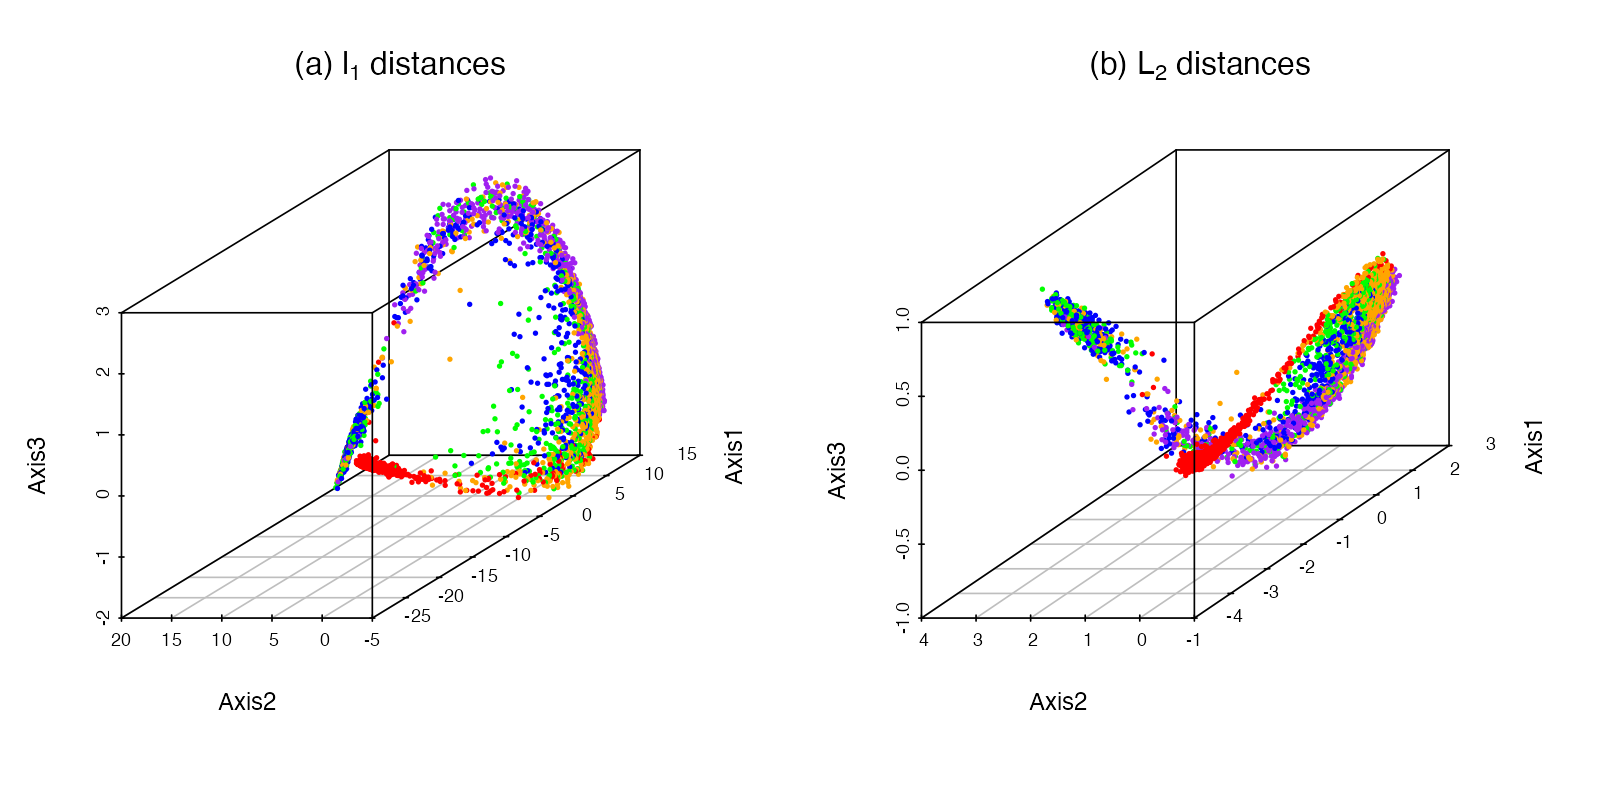
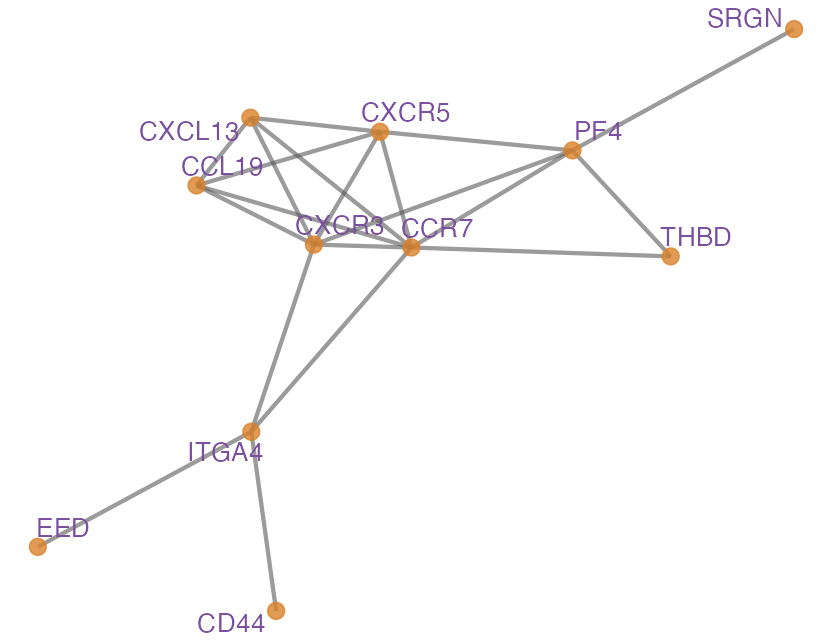
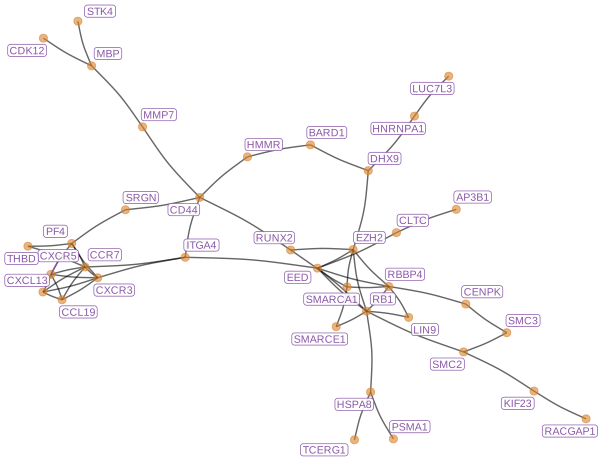
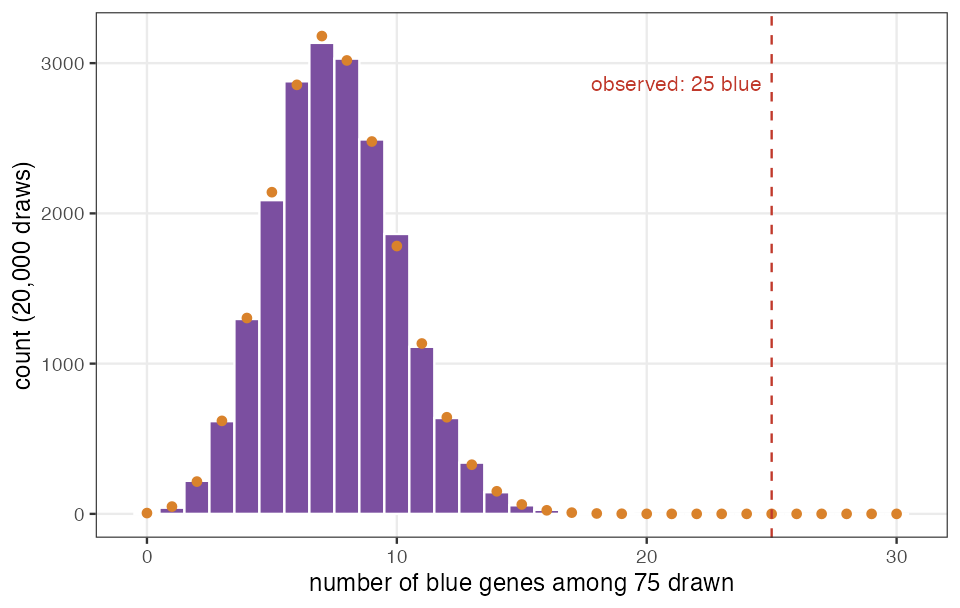
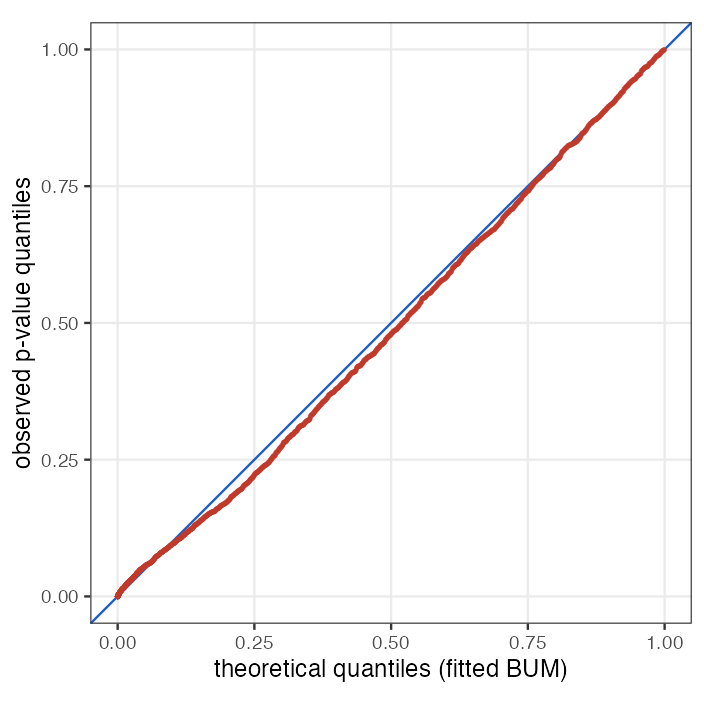
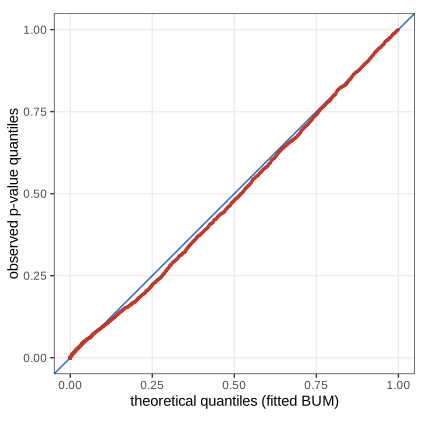
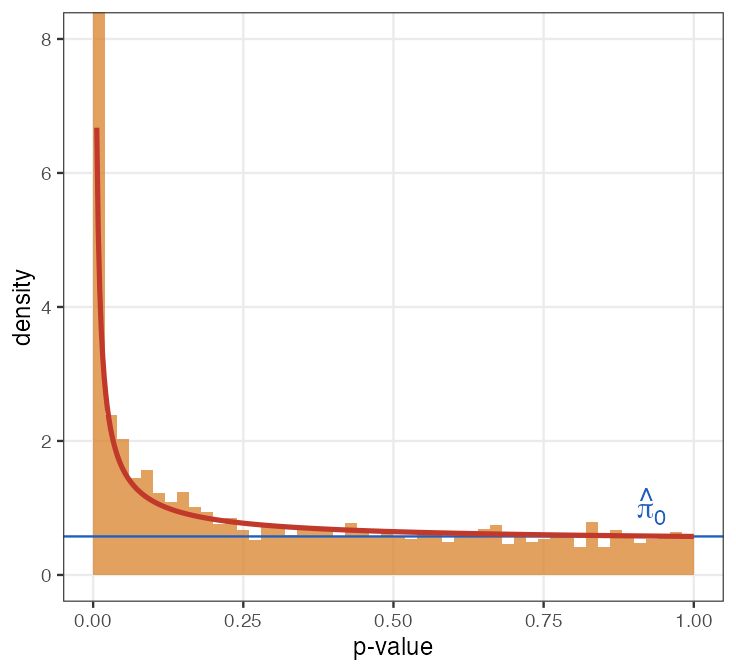
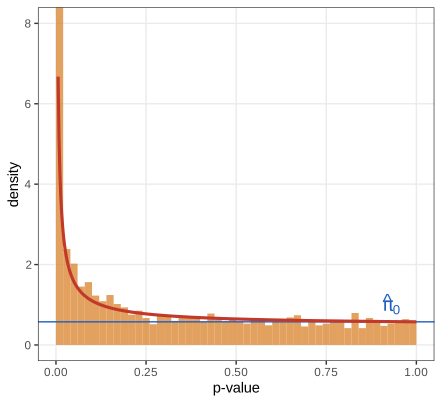
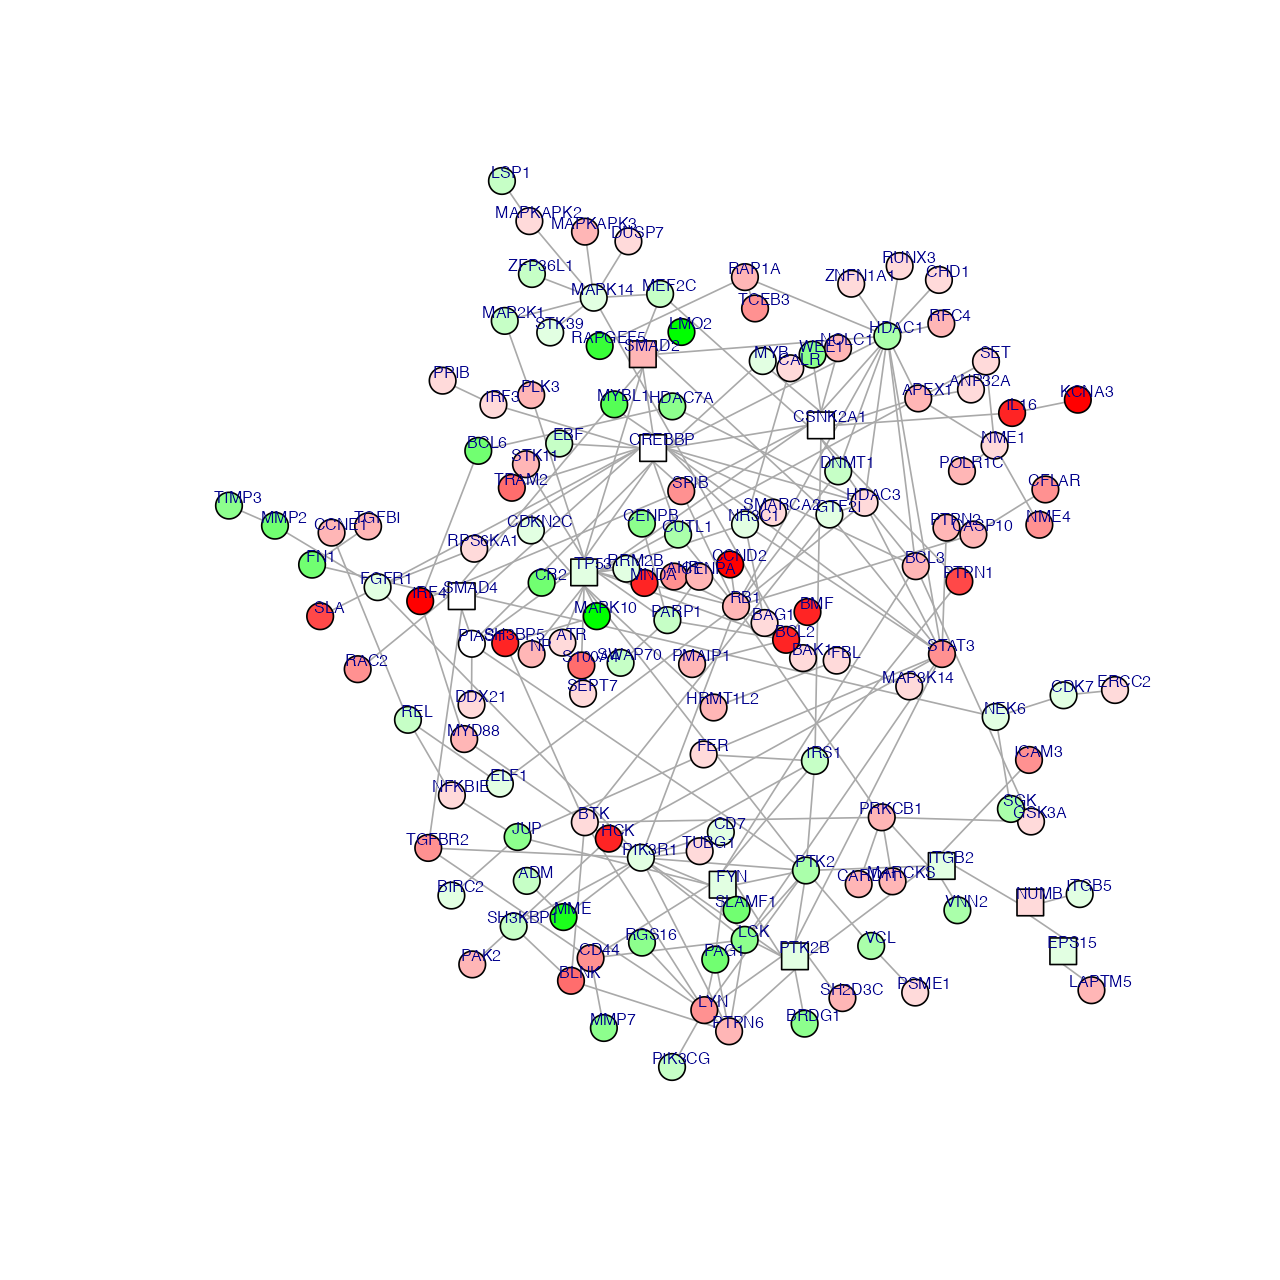
One script per chapter of Holmes and Huber, Modern Statistics for Modern Biology (2019), with one function per figure, linked to the lecture notes. The scripts are written for this course; they follow the book's analyses and use the same data and packages.
BiocManager::install(...)).MSMB_DATA to that folder (or place it at code/msmb-data).Rscript ch04_mixture_models.R (or a single figure: Rscript ch04_mixture_models.R fig_4_3), or every chapter with Rscript make_all.R.Each figure is written to img/chNN/ as PNG, SVG (except very dense plots) and PDF. Shared helpers are in common.R; the driver is make_all.R. Slow steps are cached in code/cache/.
Packages used: ade4, airway, AnnotationDbi, ape, Biobase, BioNet, Biostrings, BSgenome.Celegans.UCSC.ce2, BSgenome.Ecoli.NCBI.20080805, BSgenome.Hsapiens.UCSC.hg19, caret, class, clue, cluster, clusterExperiment, dada2, dbscan, DECIPHER, deldir, DESeq2, diffusionMap, DLBCL, dplyr, EBImage, edgeR, ExperimentHub, fdrtool, flexmix, flowCore, flowPeaks, fpc, genefilter, GenomeInfoDb, GenomicRanges, GGally, ggbeeswarm, ggplot2, ggraph, ggrepel, ggridges, ggthemes, ggtree, glmnet, graph, gridExtra, HardyWeinberg, Hiiragi2013, HistData, igraph, IHW, IRanges, jsonlite, kernlab, limma, LPCM, lpSolve, markovchain, MASS, MatrixGenerics, matrixStats, mclust, mixtools, modeltools, mosaics, mouse4302.db, network, patchwork, phangorn, pheatmap, phyloseq, phyloseqGraphTest, PMA, polyclip, pROC, pwr, ragg, RColorBrewer, readr, rrcov, RSpectra, Rtsne, scatterplot3d, seqLogo, structSSI, SummarizedExperiment, survey, sva, svglite, tibble, tidyr, vcd, vegan.
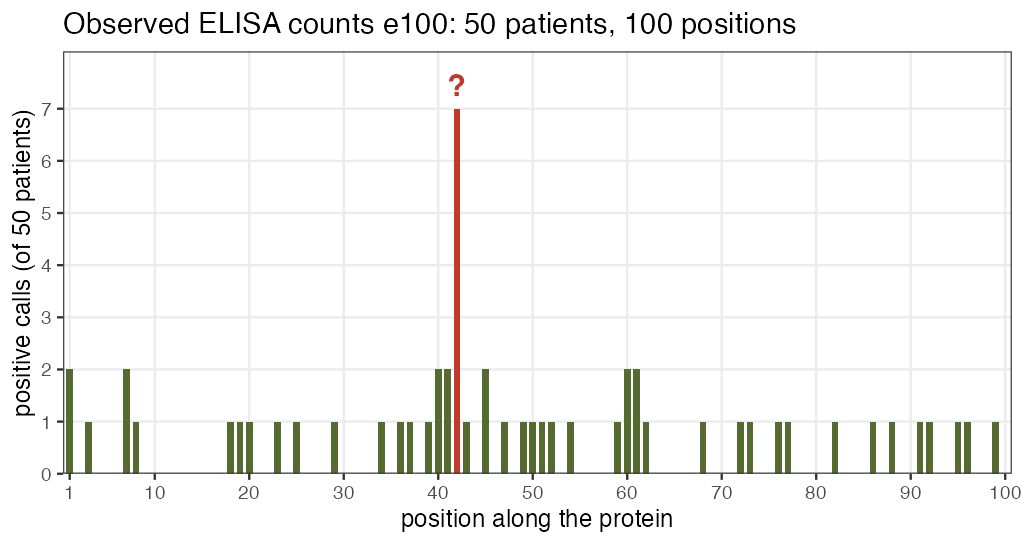
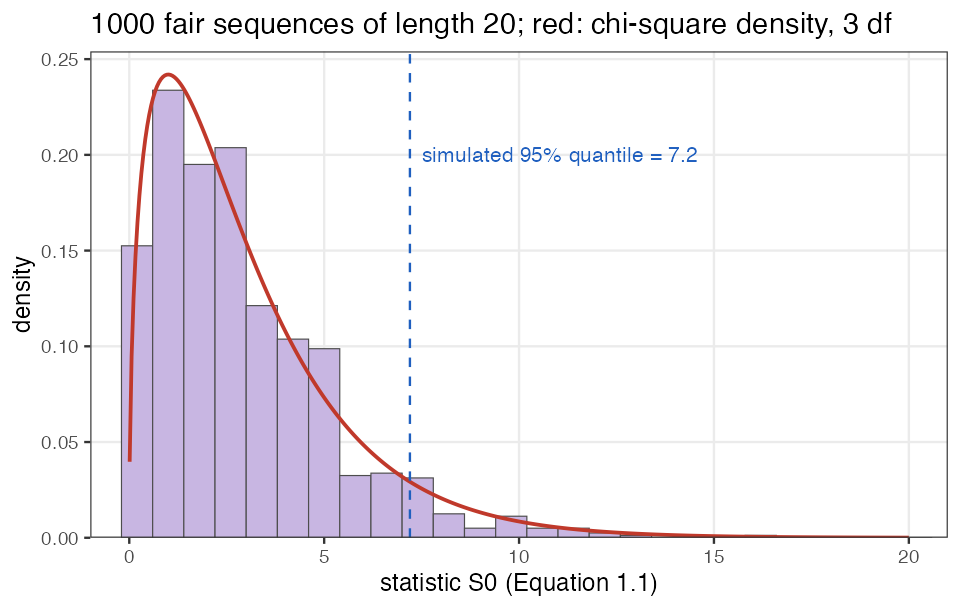
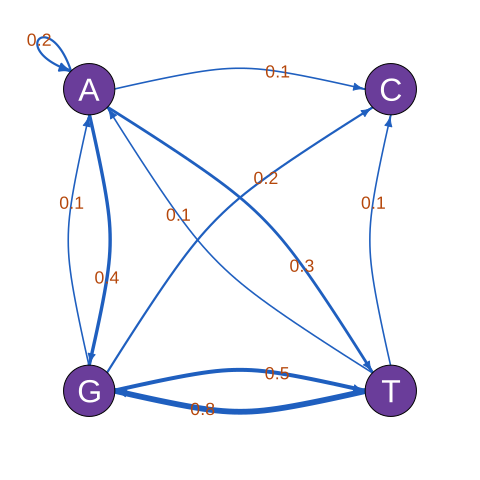
Figures: ch01_generative_discrete.R · Notes: Generative Models for Discrete Data
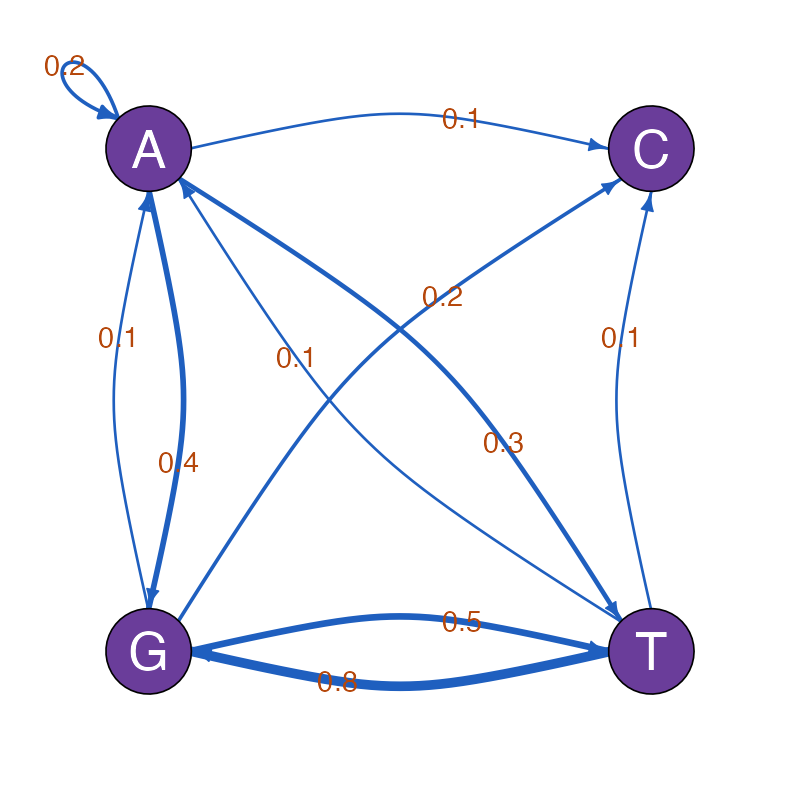
Figures: ch02_statistical_modeling.R · Notes: Statistical Modeling
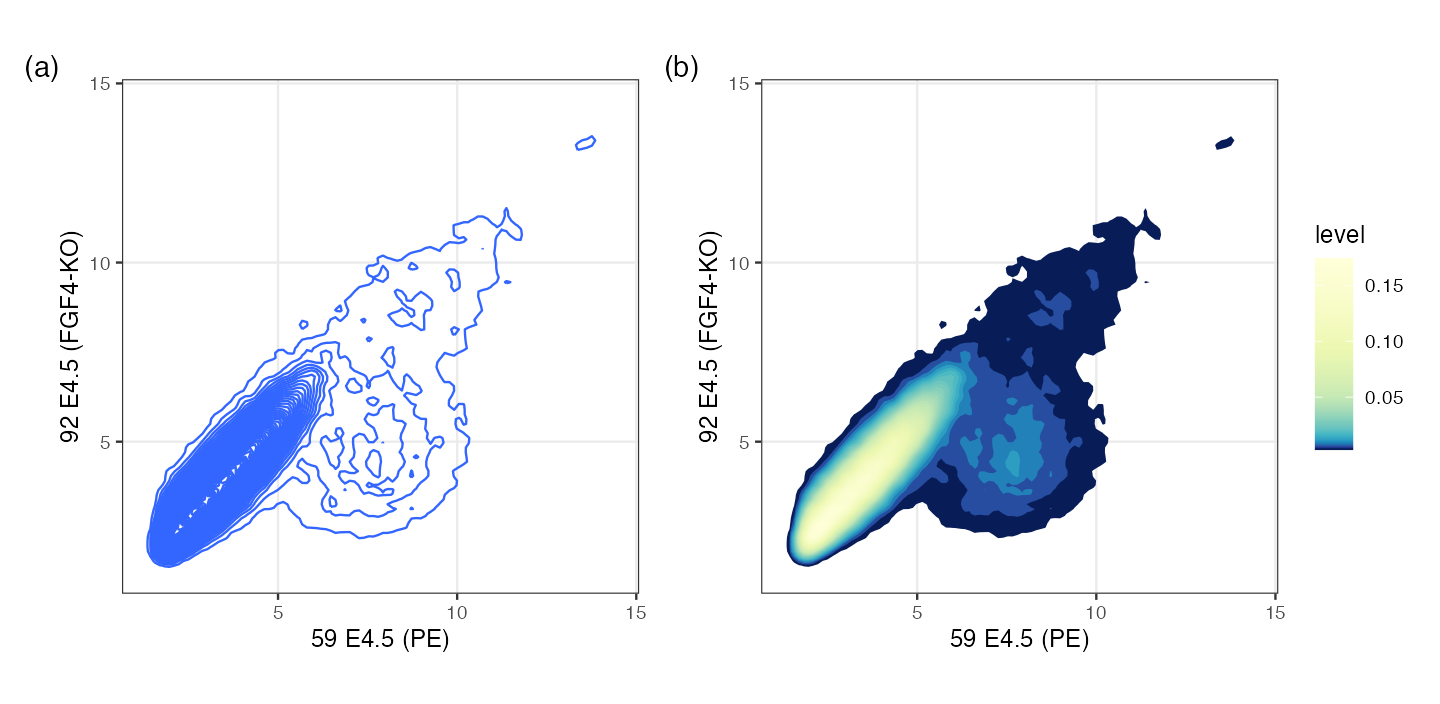
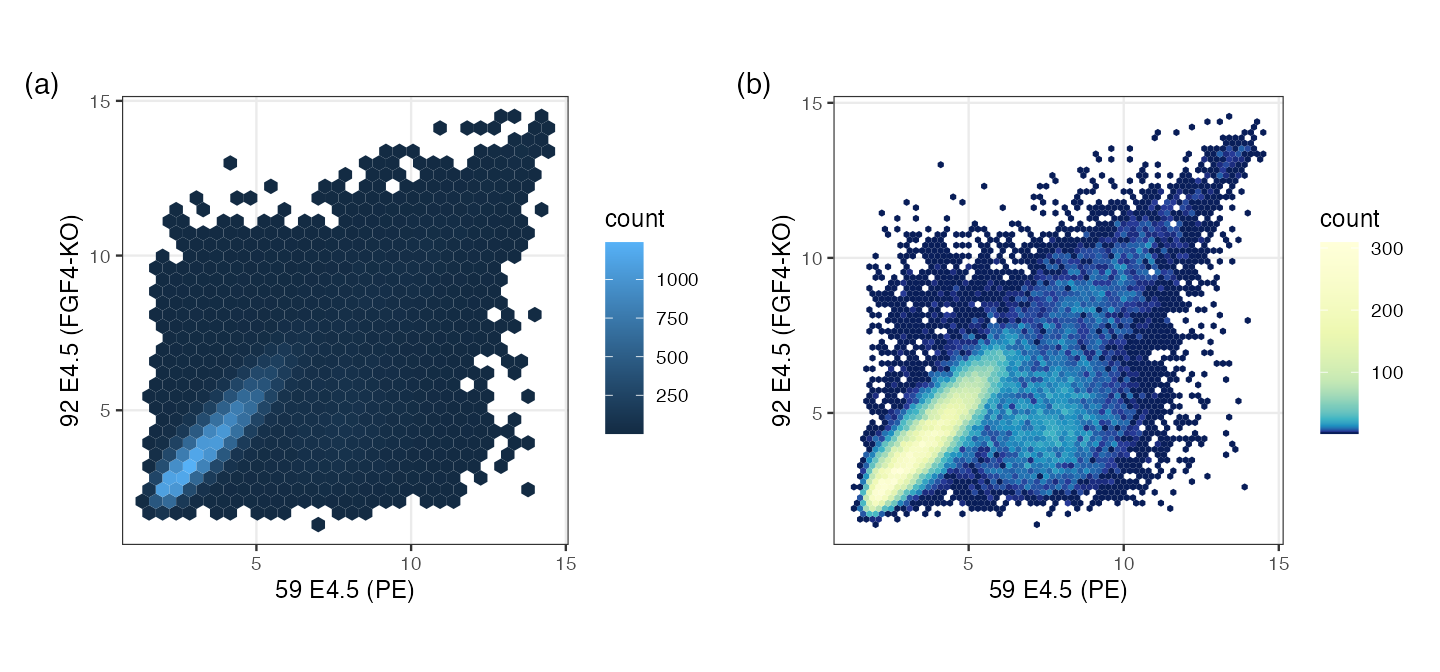
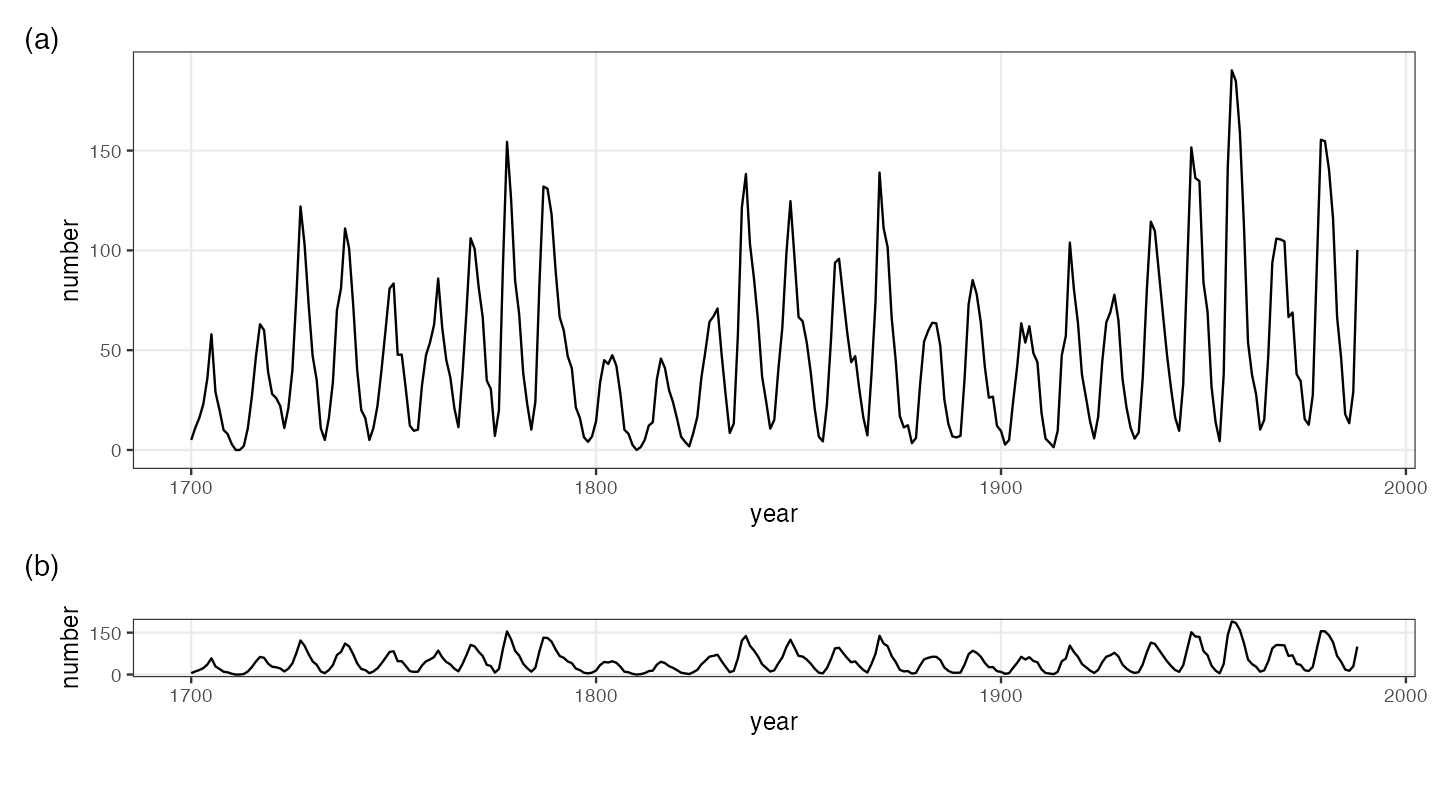
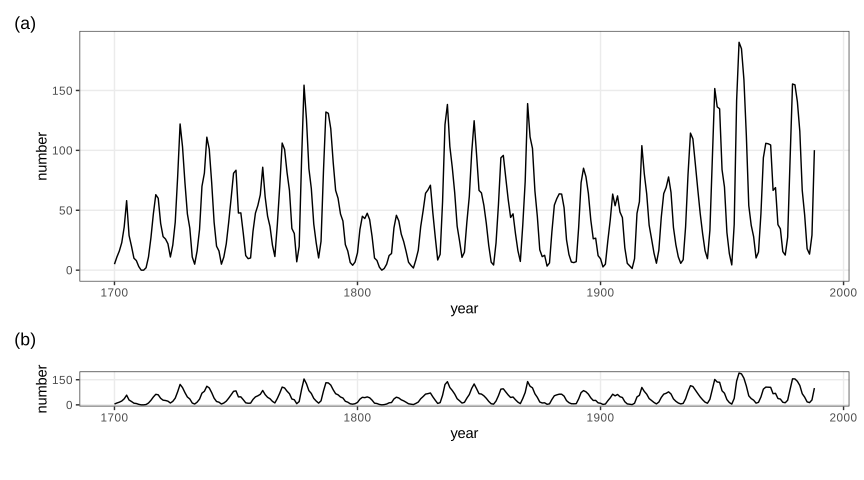
Figures: ch03_data_visualization.R · Notes: Data visualization
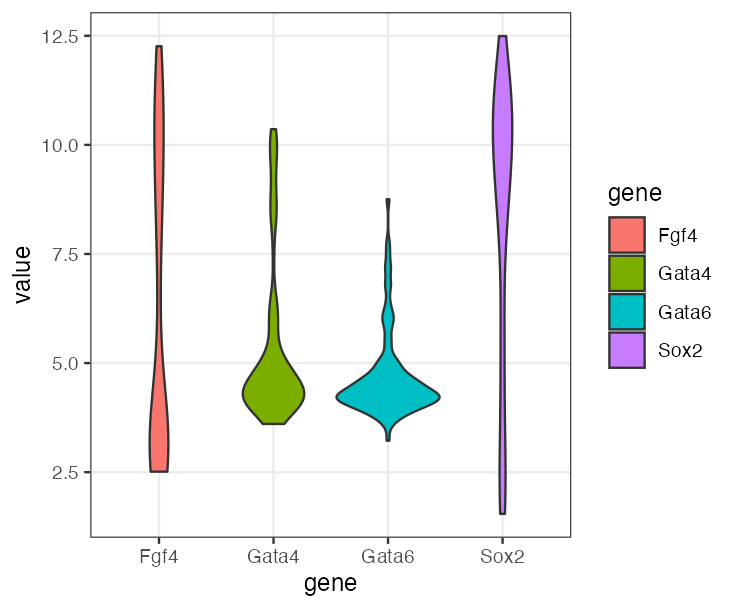
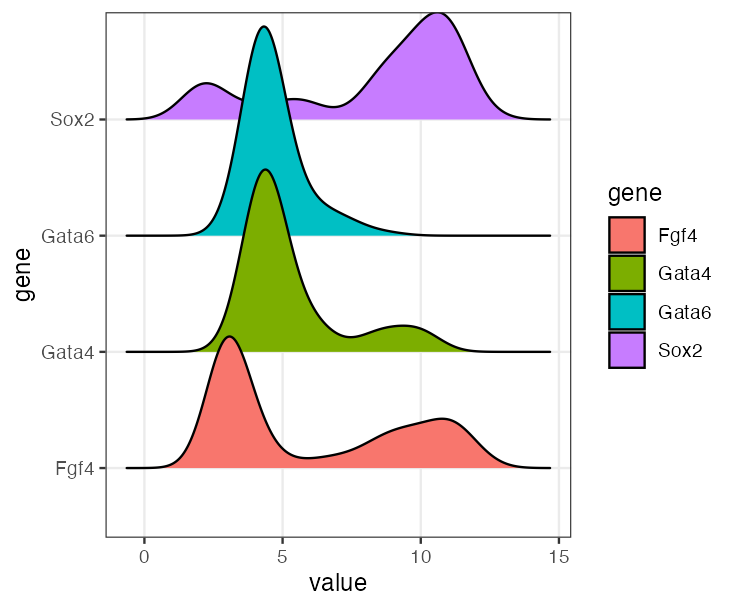
Figures: ch04_mixture_models.R · Notes: Mixture Models
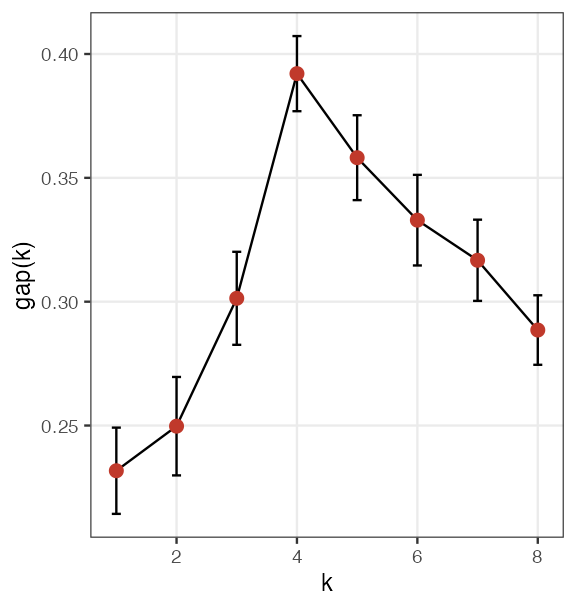
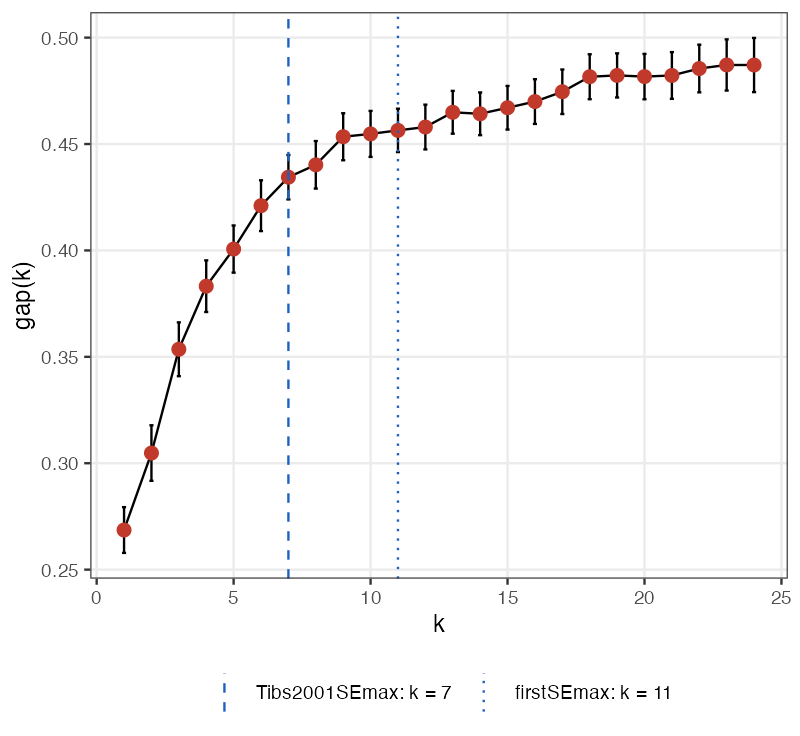
Figures: ch05_clustering.R · Notes: Clustering
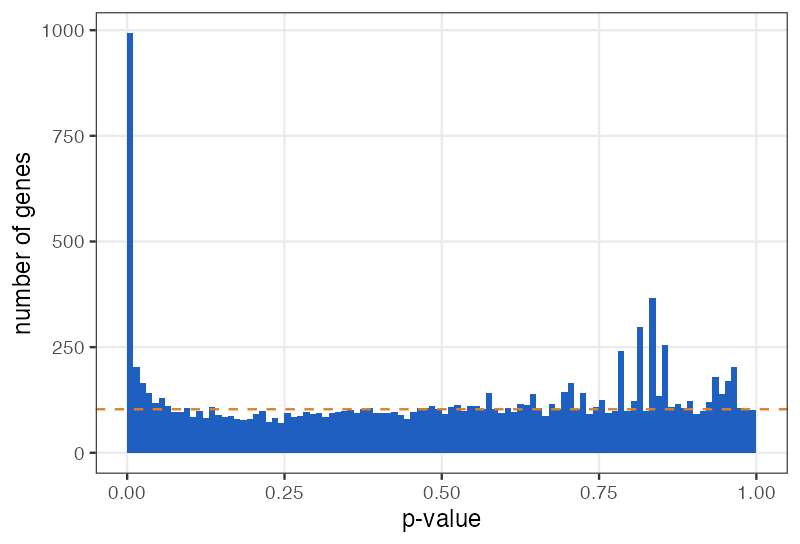
Figures: ch06_testing.R · Notes: Testing
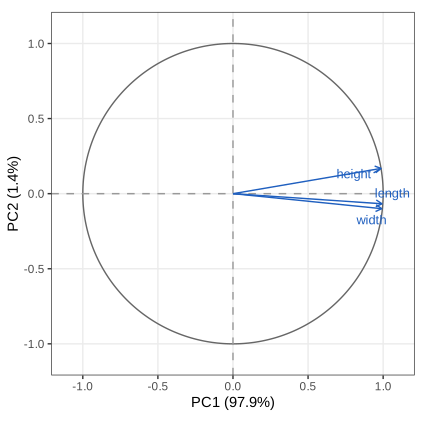
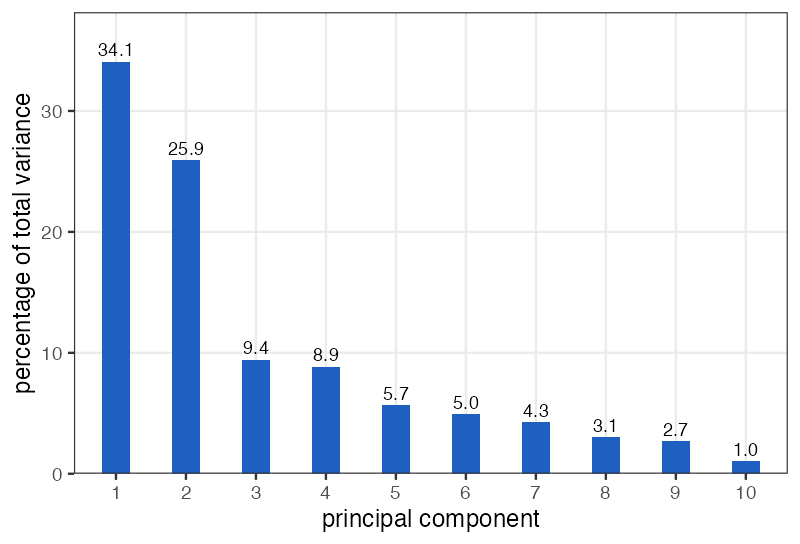
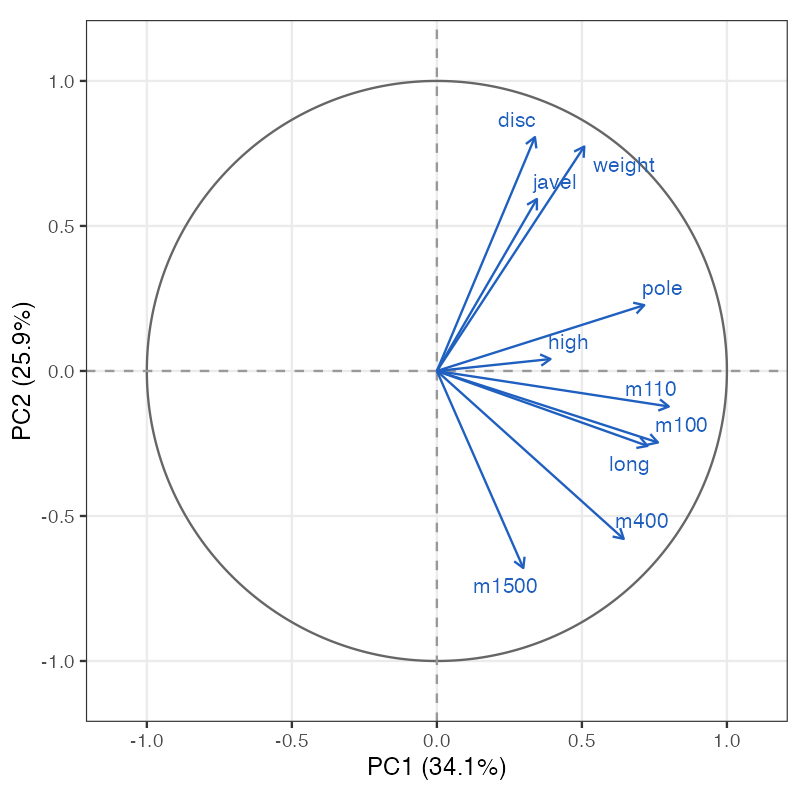
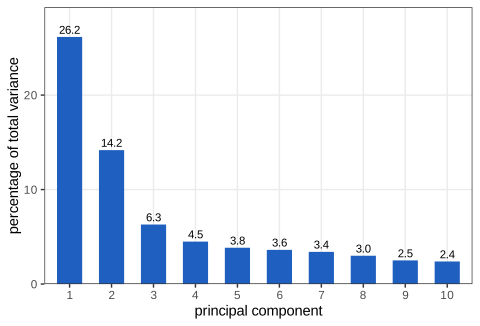
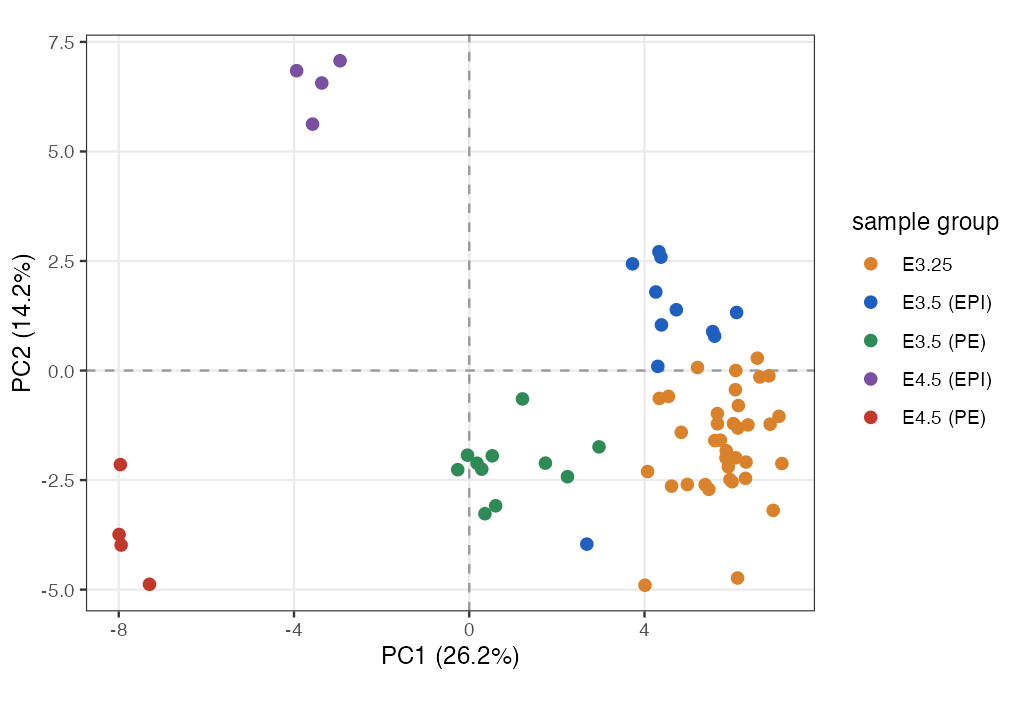
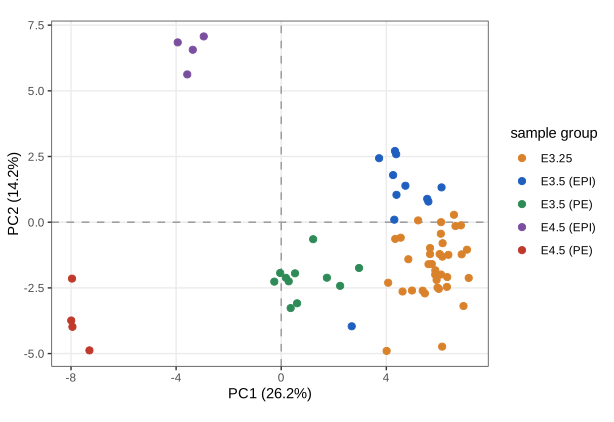
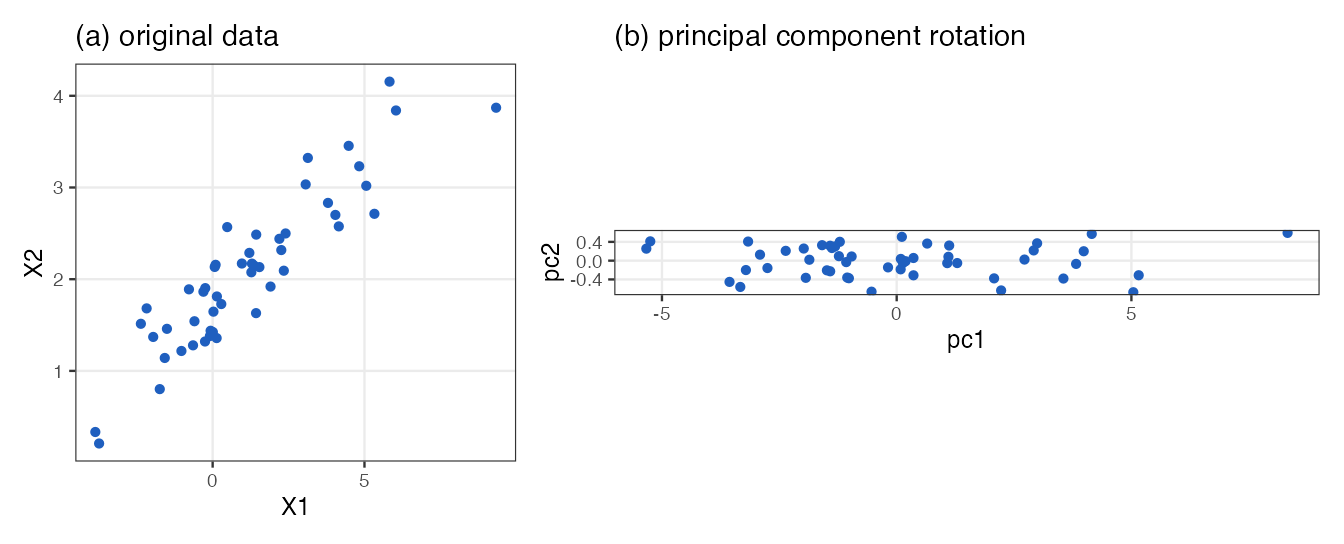
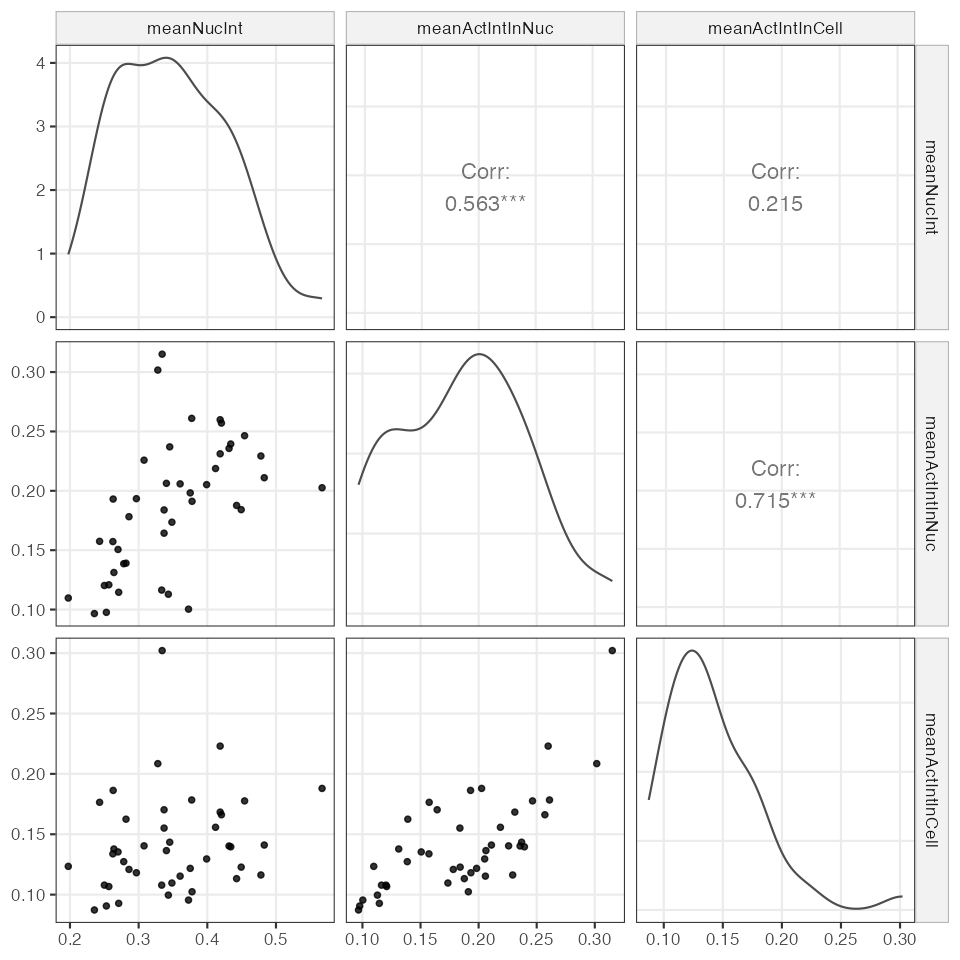
Figures: ch07_multivariate_analysis.R · Notes: Multivariate Analysis
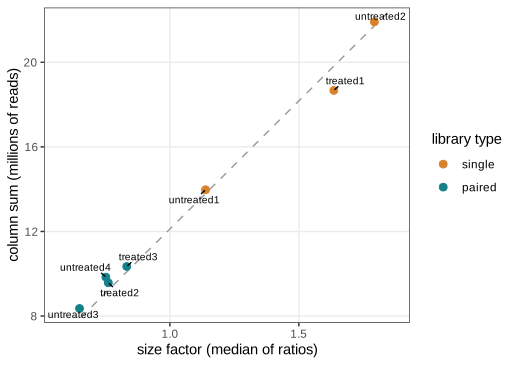
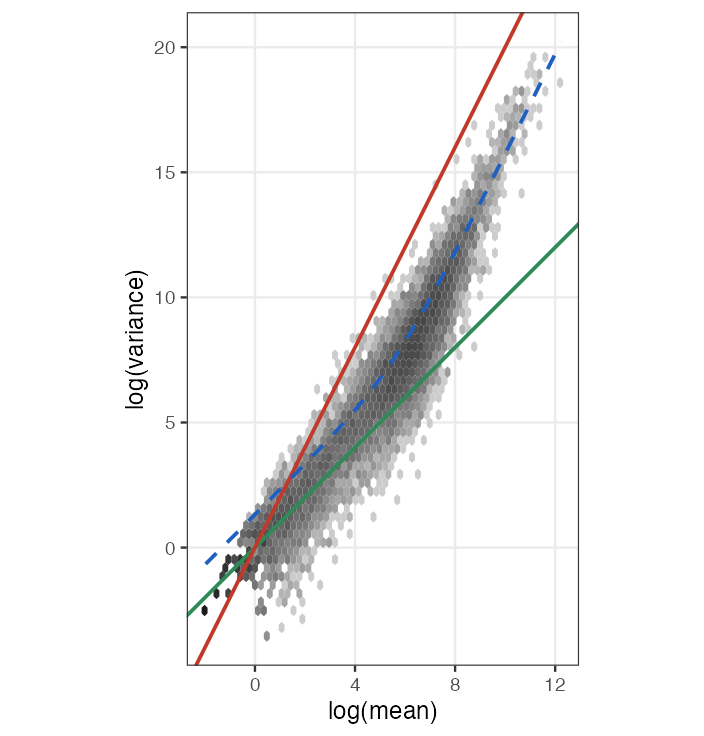
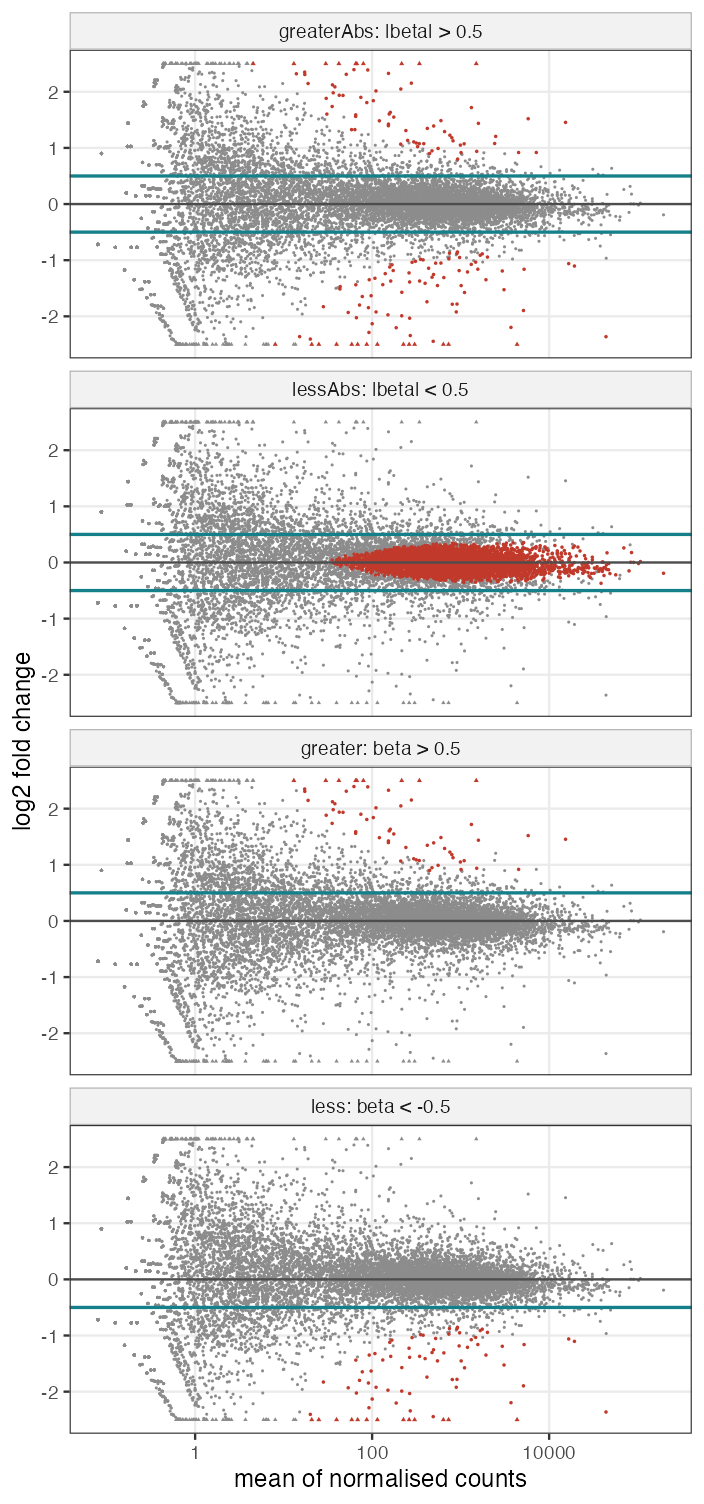
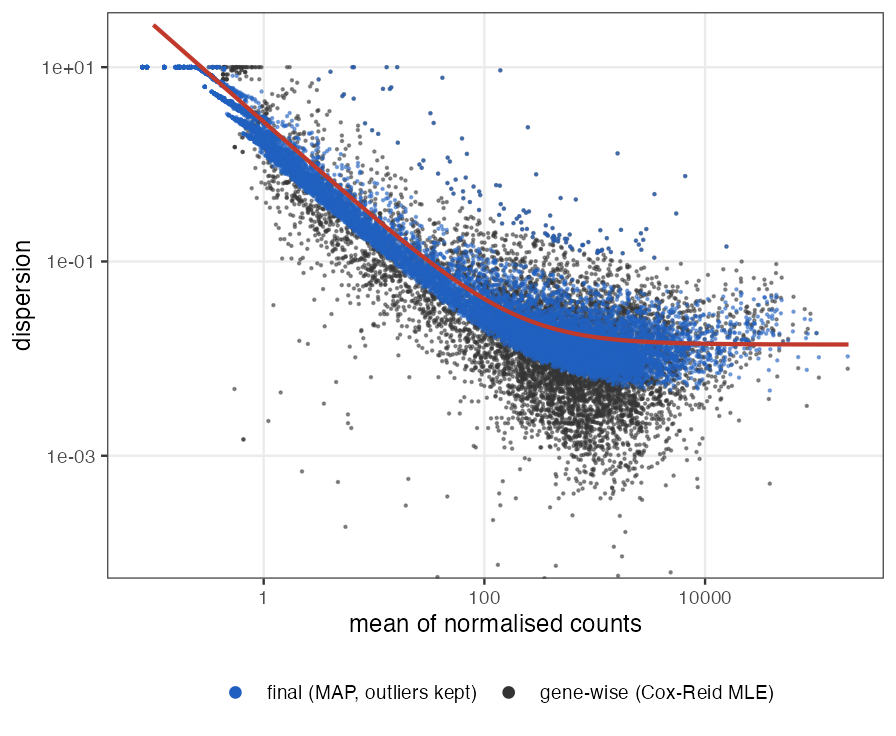
Figures: ch08_count_data_glm.R · Notes: High-Throughput Count Data and Generalized Linear Models
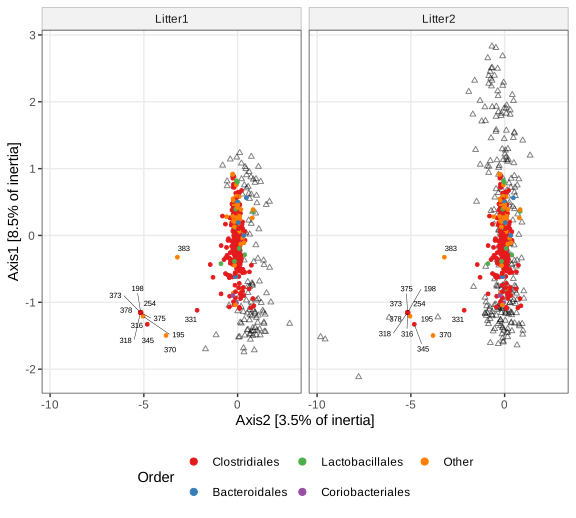
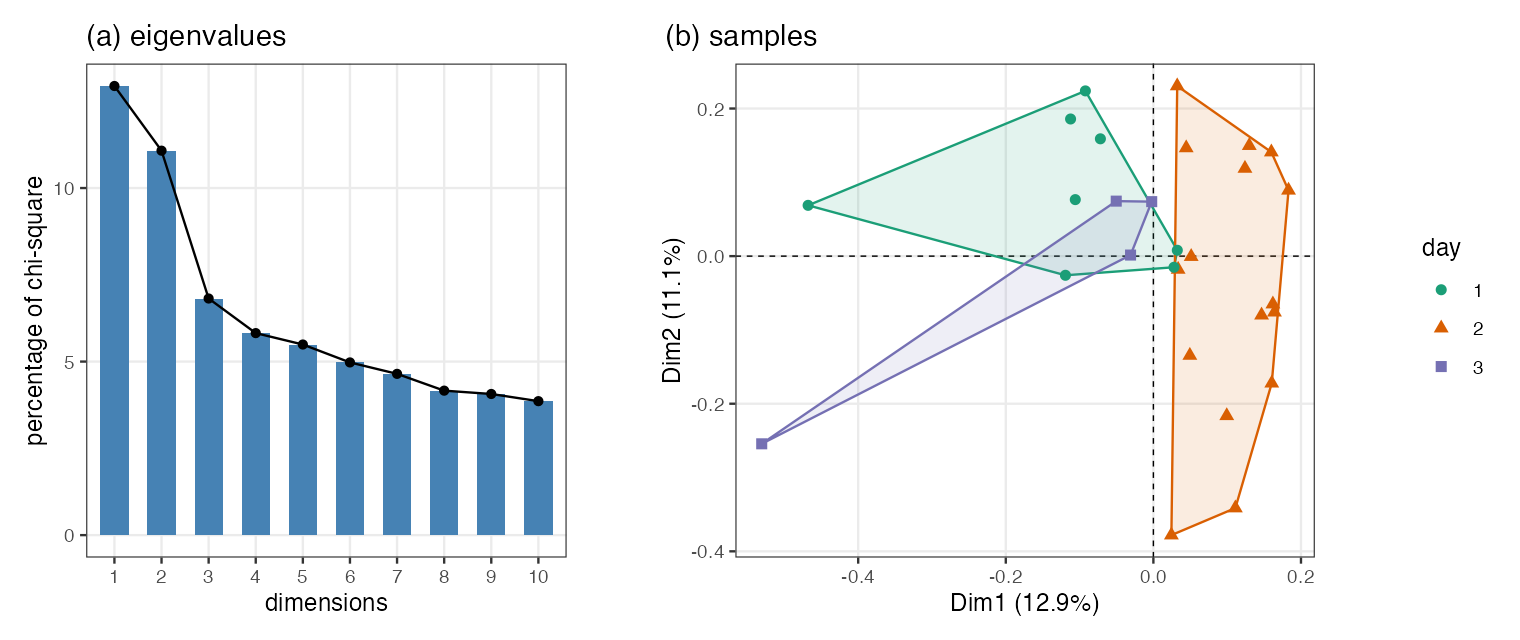
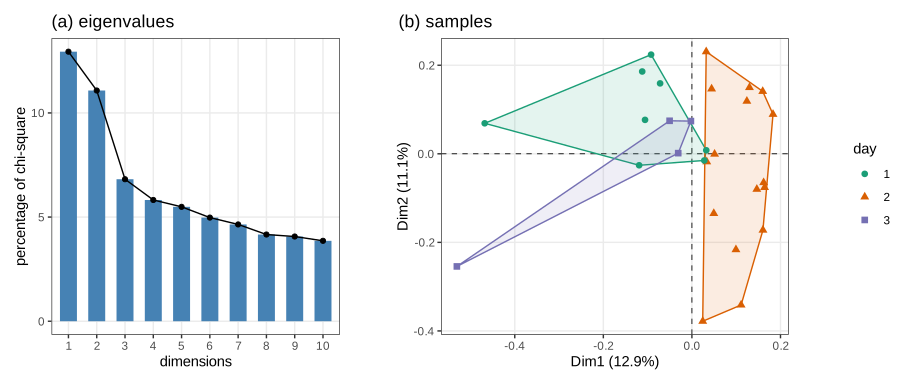
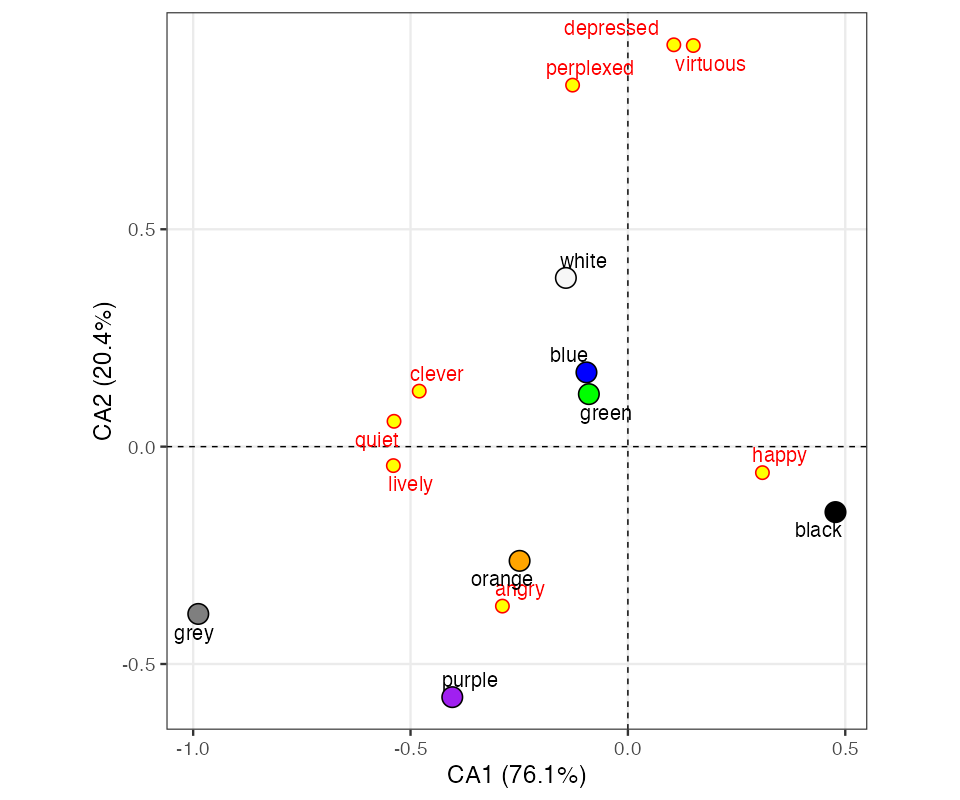
Figures: ch09_heterogeneous_data_a.R ch09_heterogeneous_data_b.R · Notes: Multivariate methods for heterogeneous data
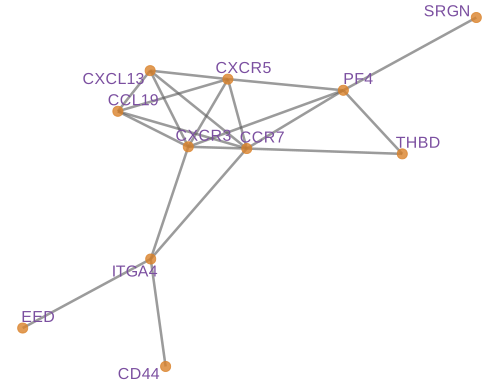
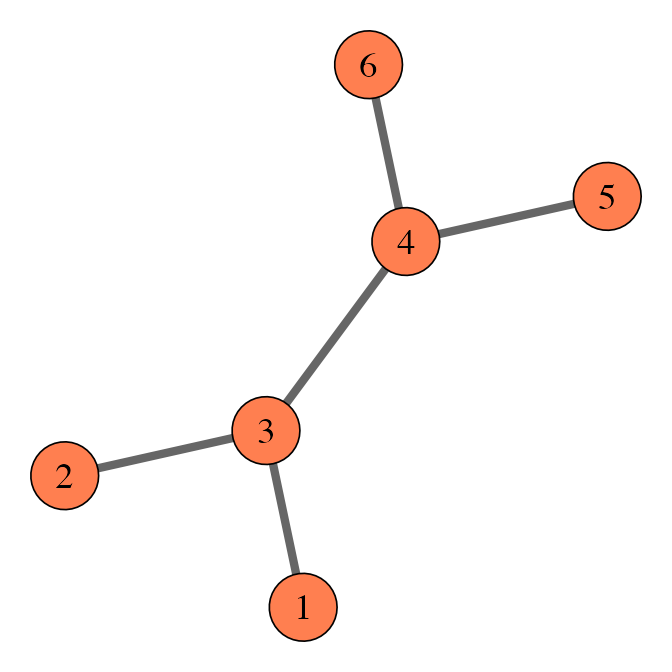
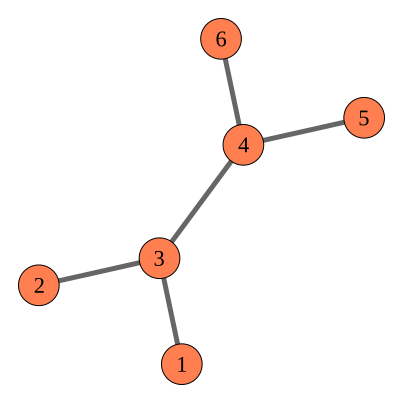
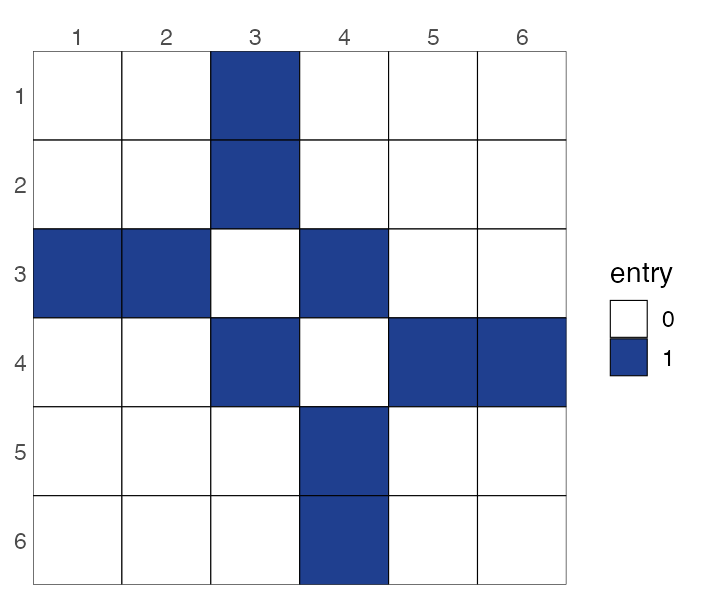
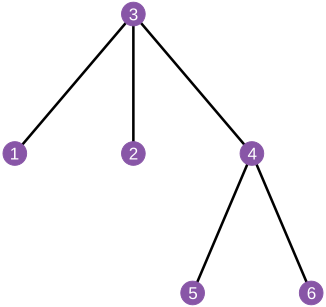
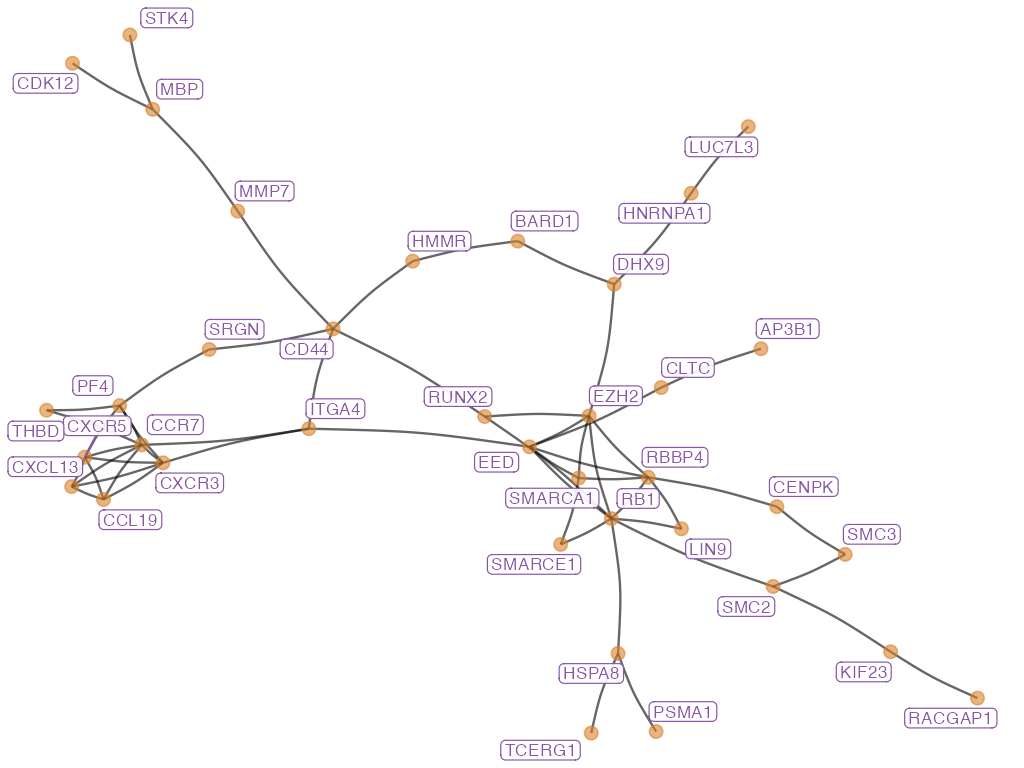
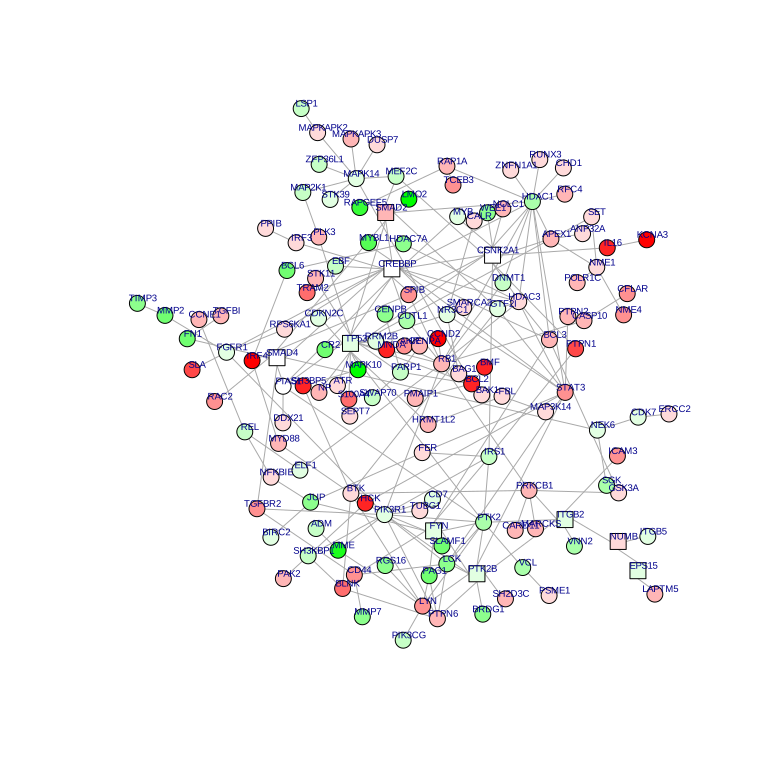
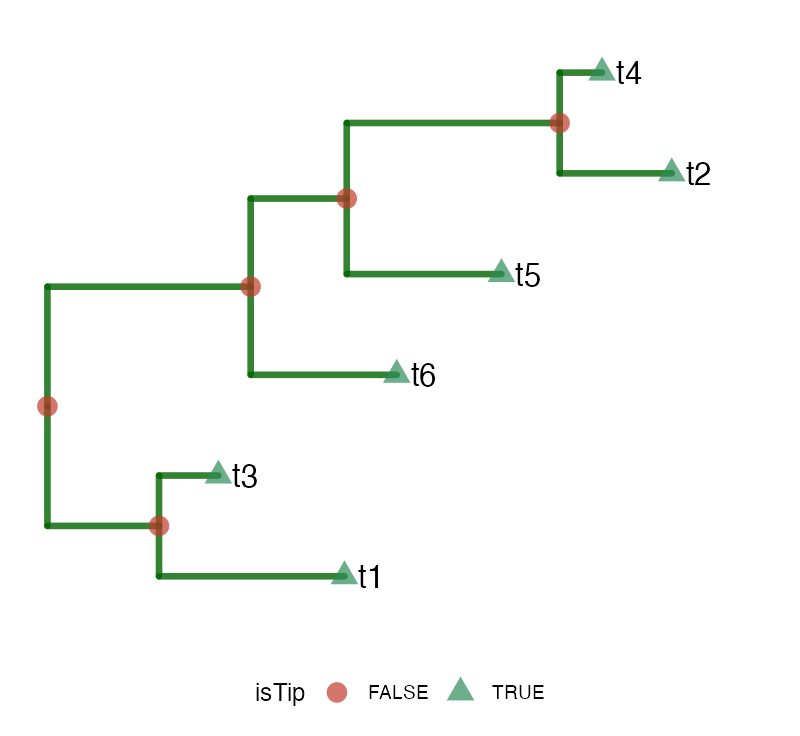
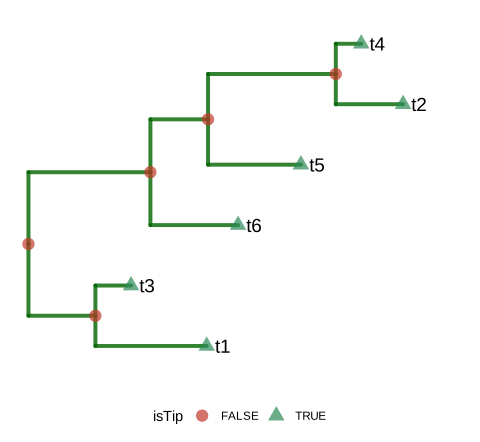
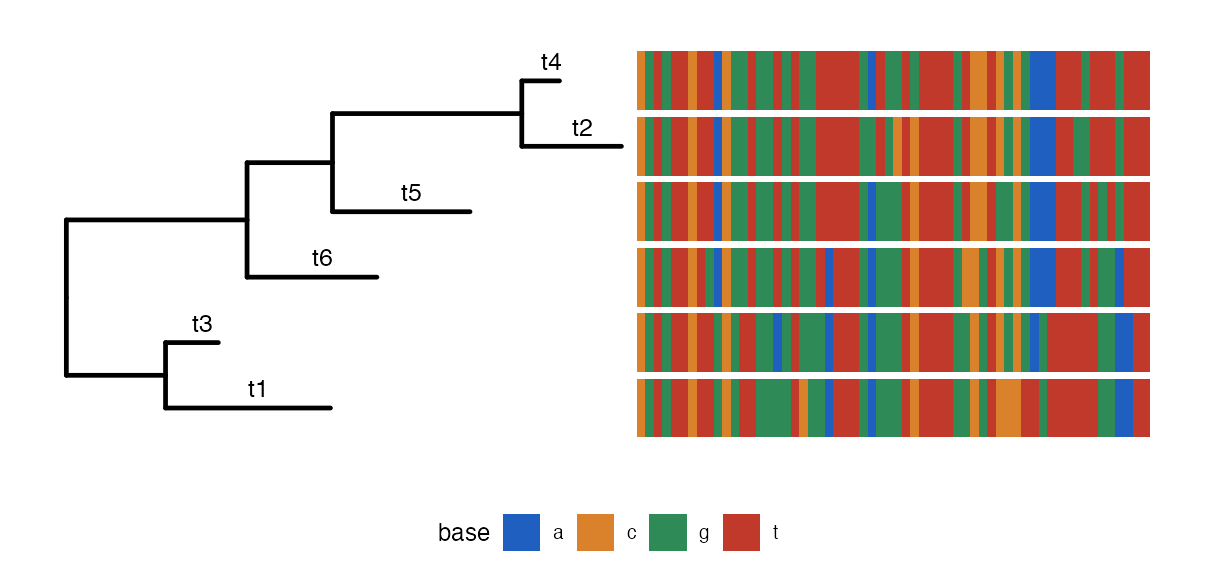
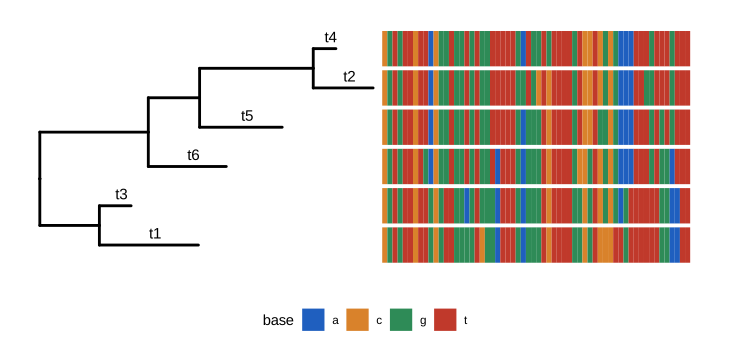
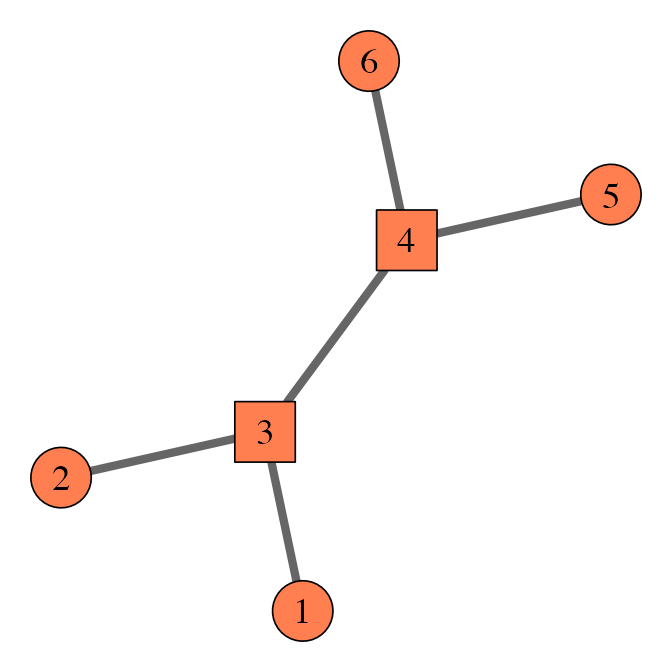
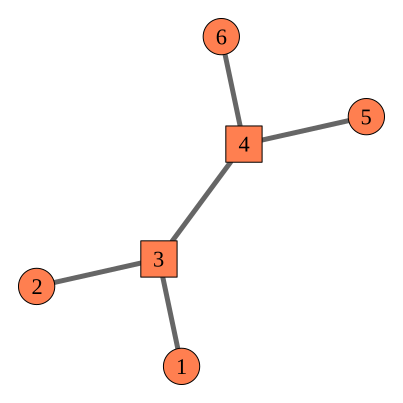
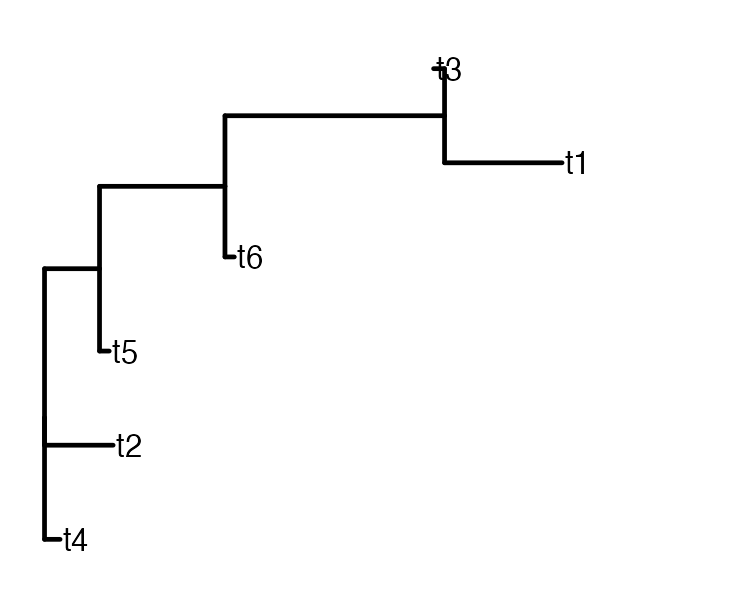
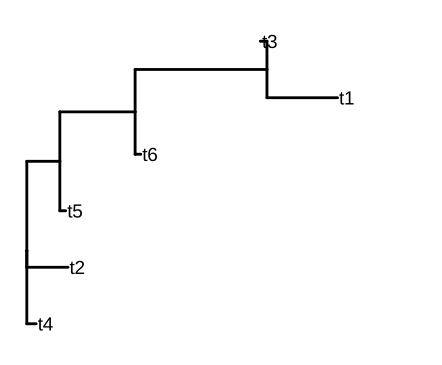
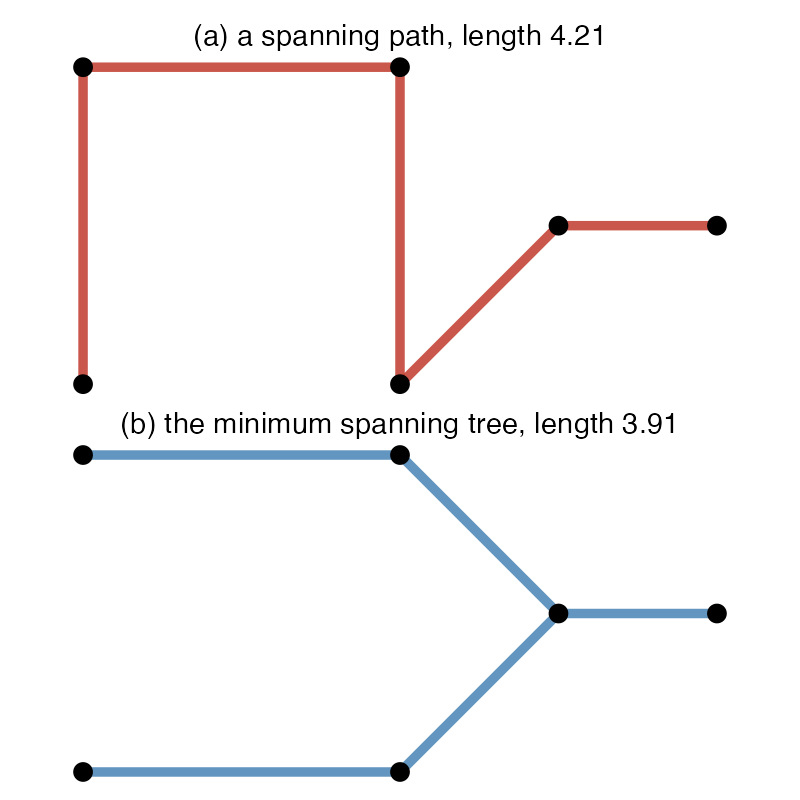
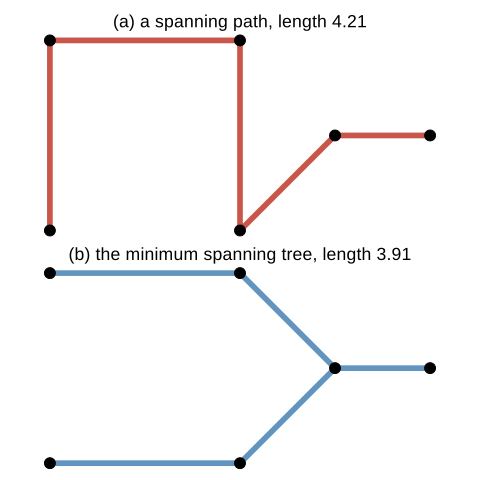
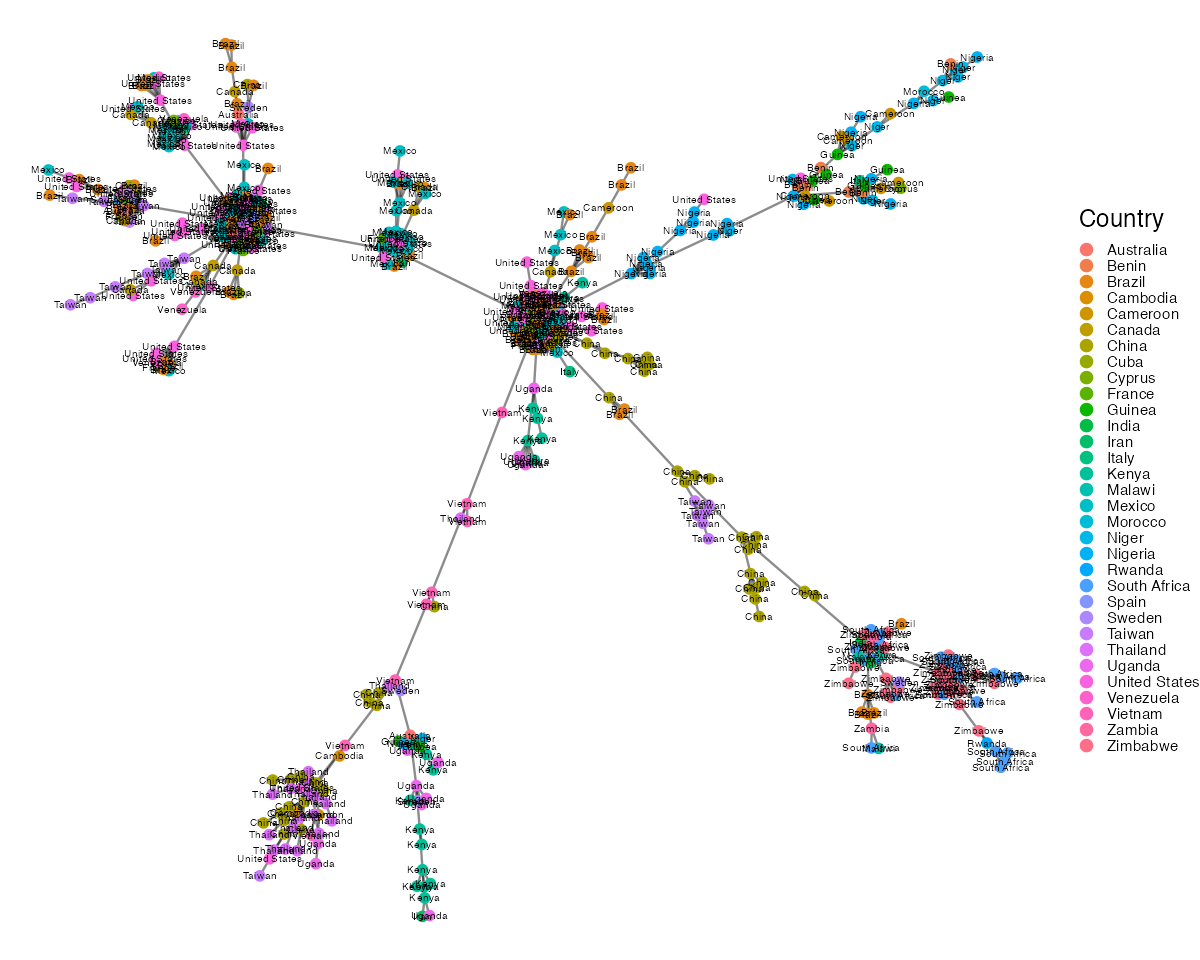
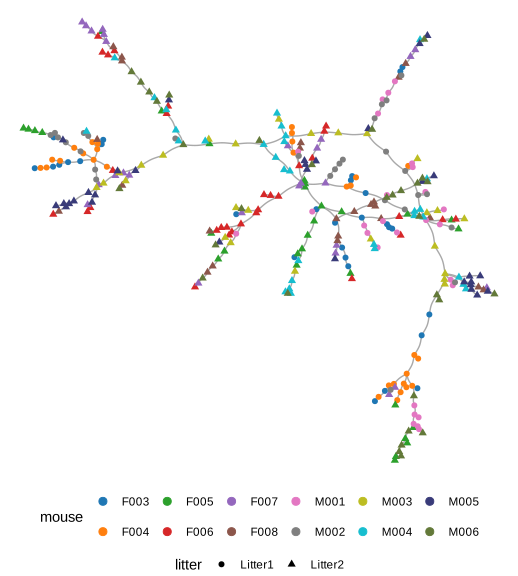
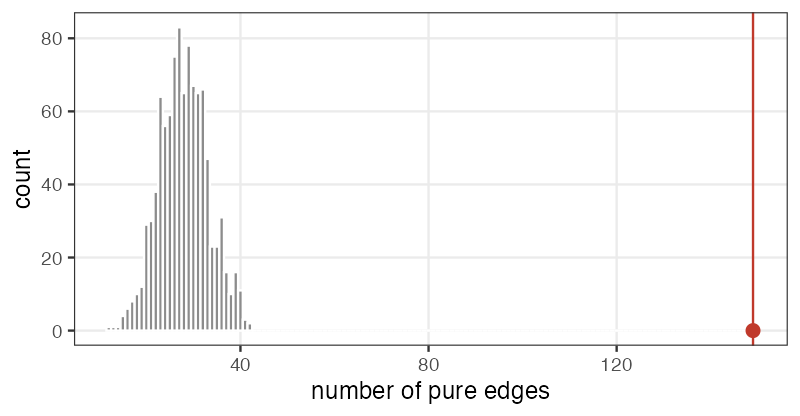
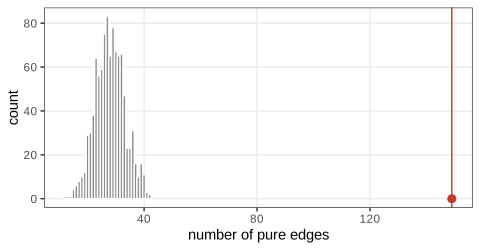
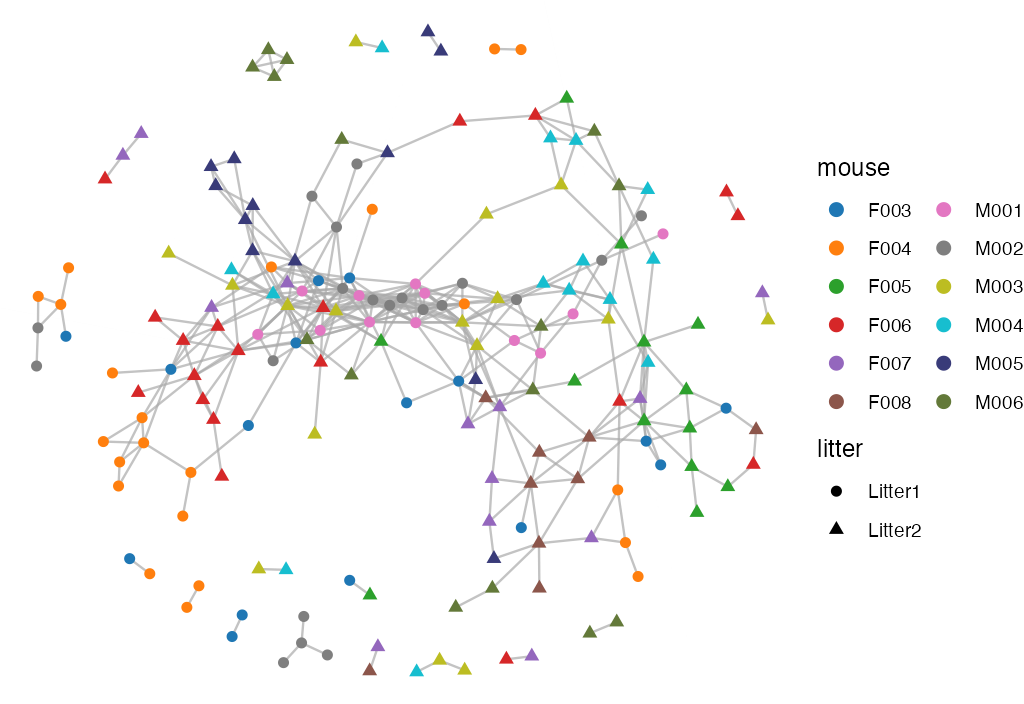
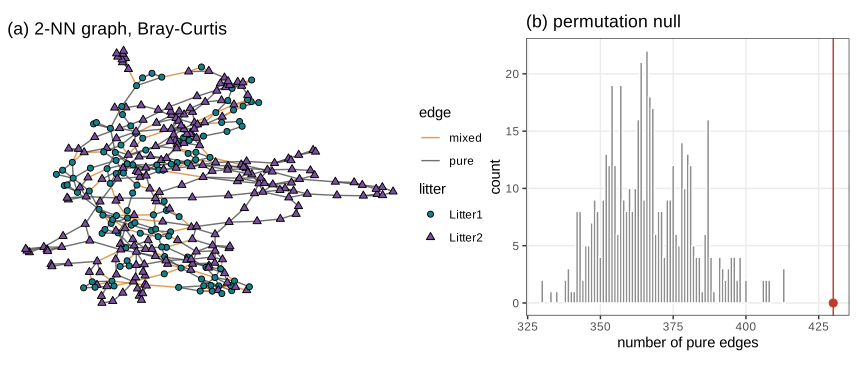
Figures: ch10_networks_trees.R · Notes: Networks and Trees
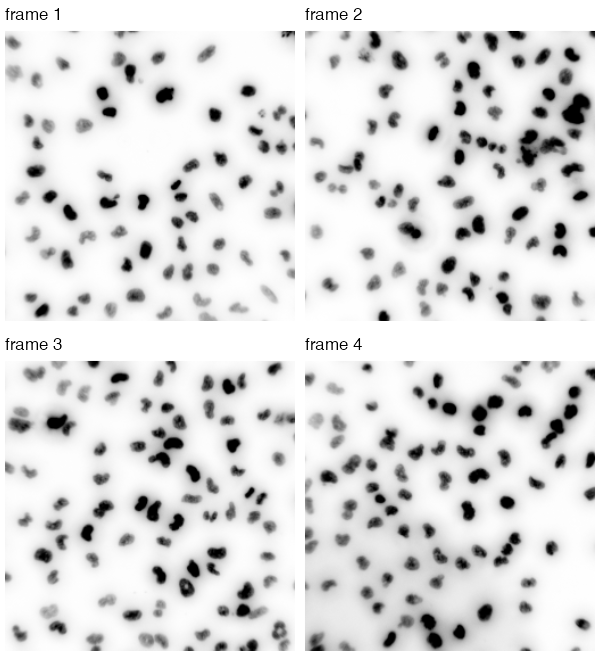
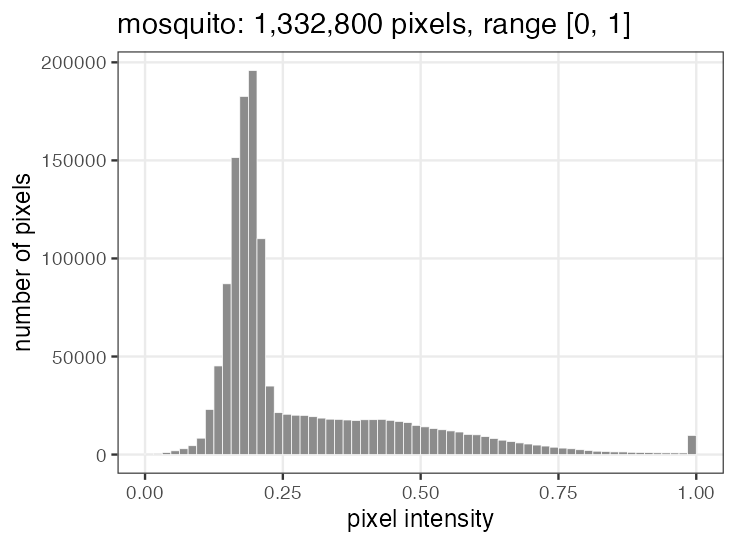
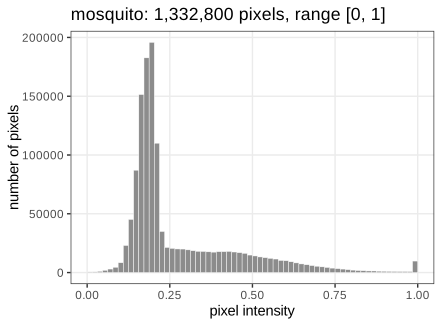
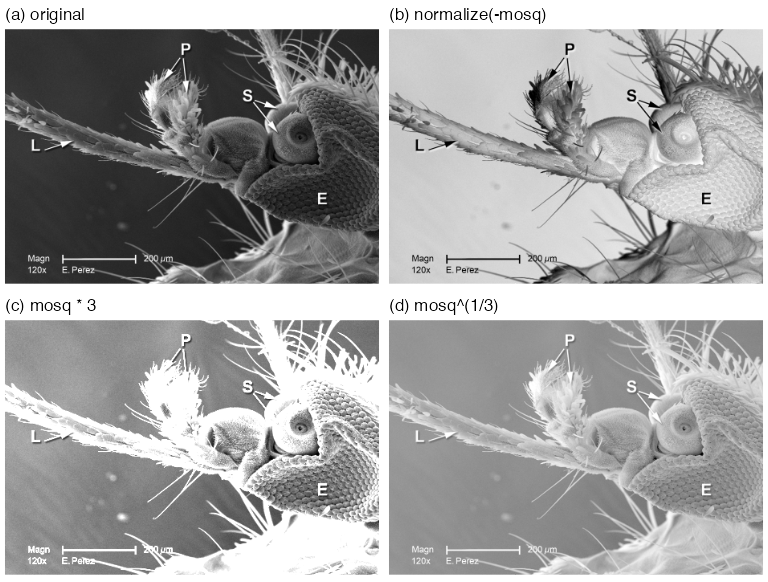
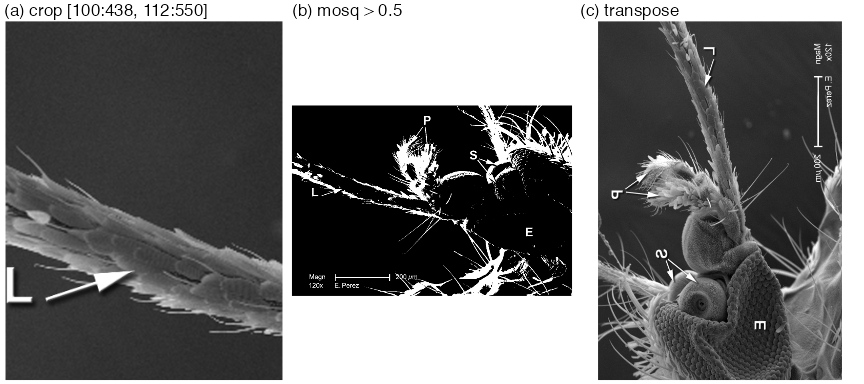
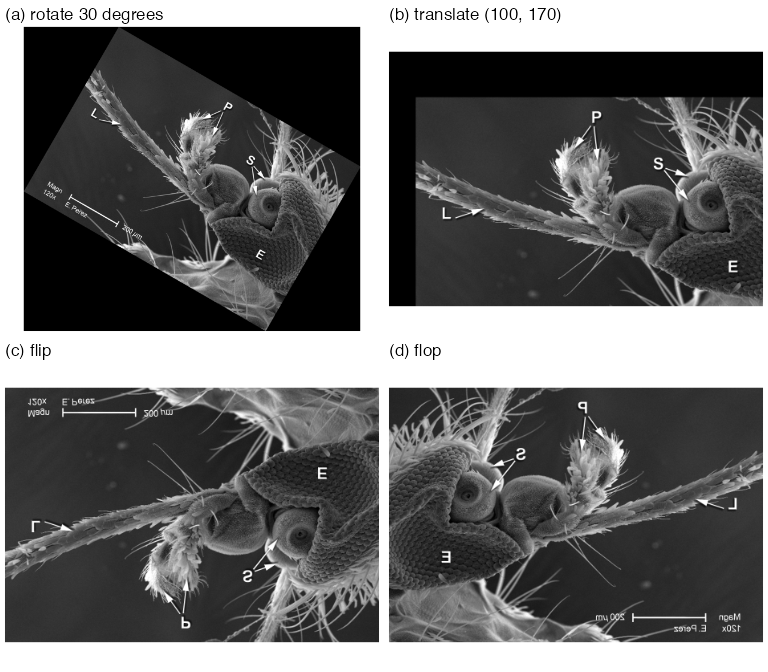
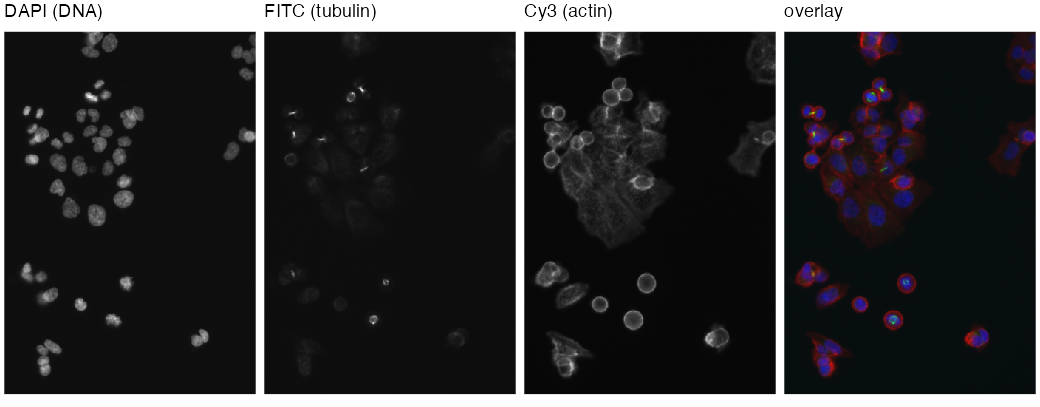
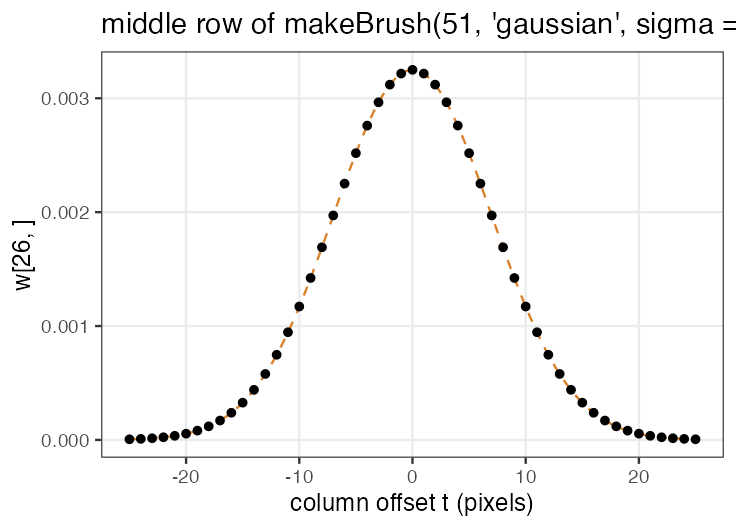
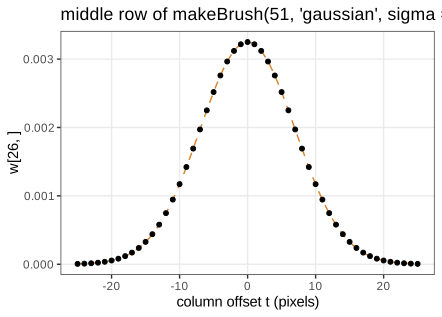
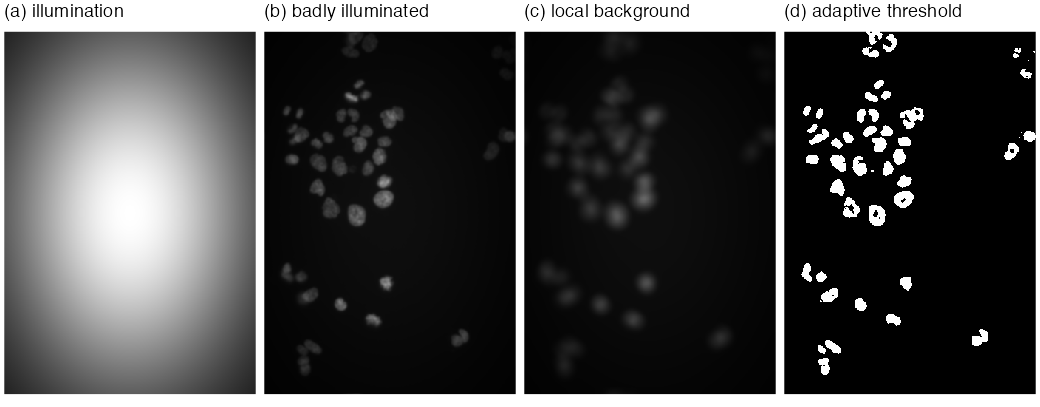
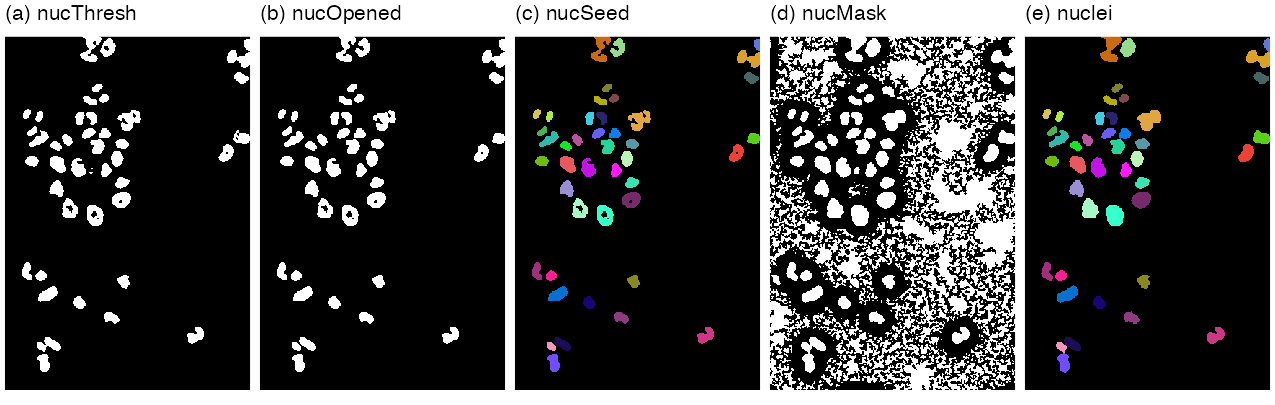
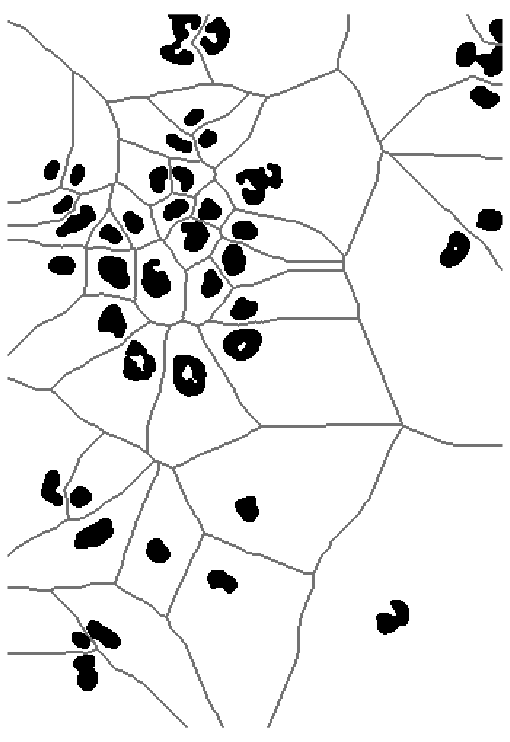
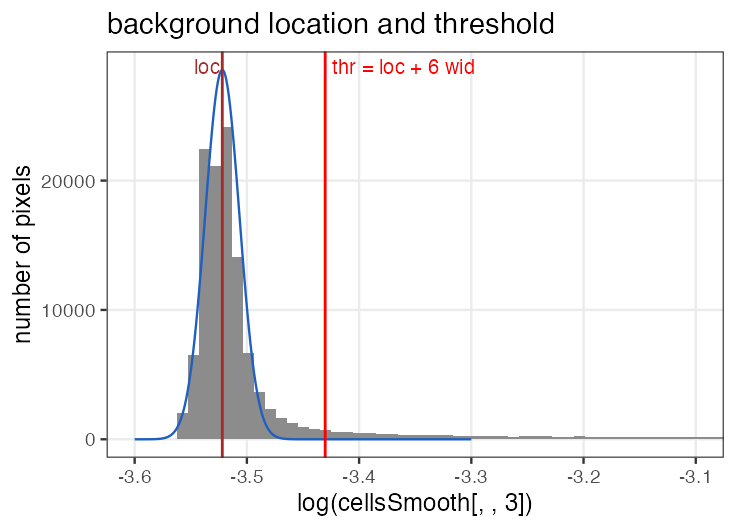
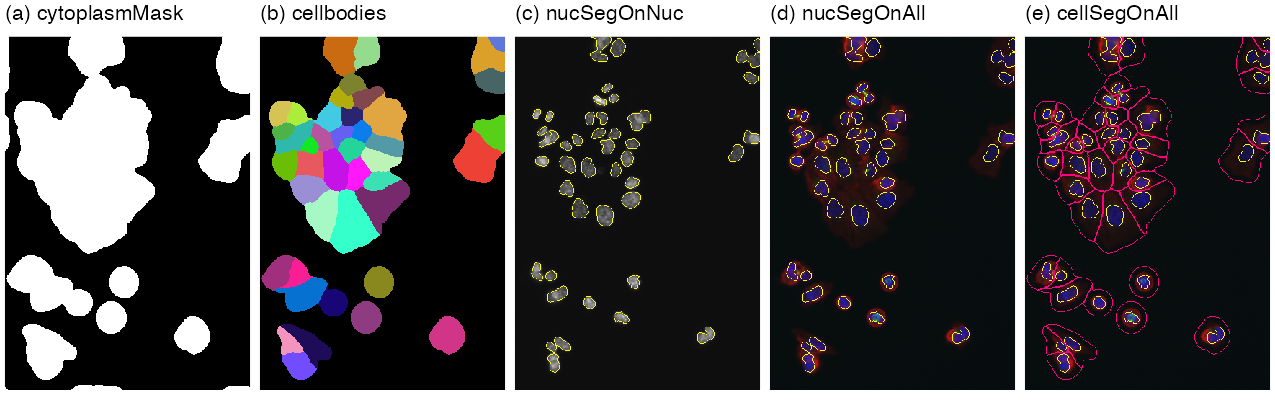
Figures: ch11_image_data.R · Notes: Image data
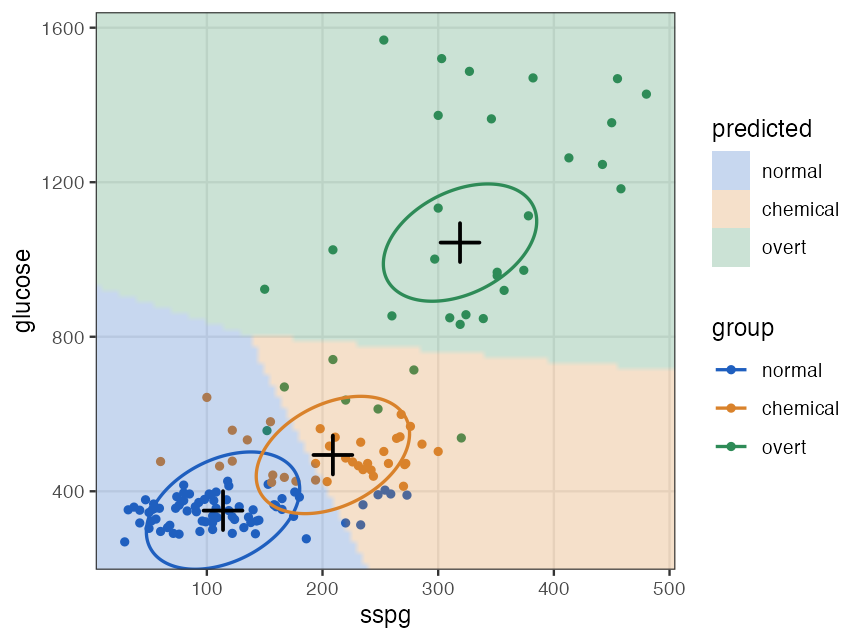
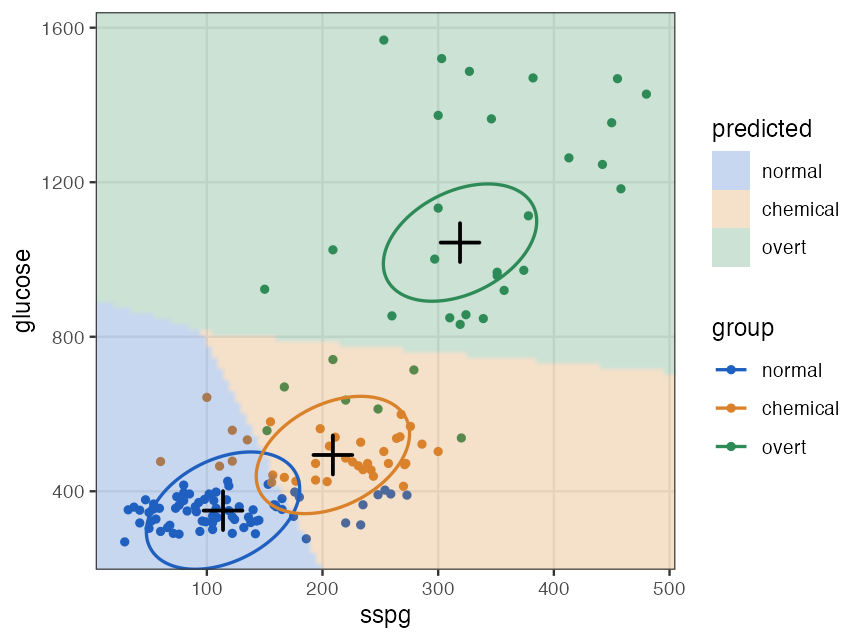
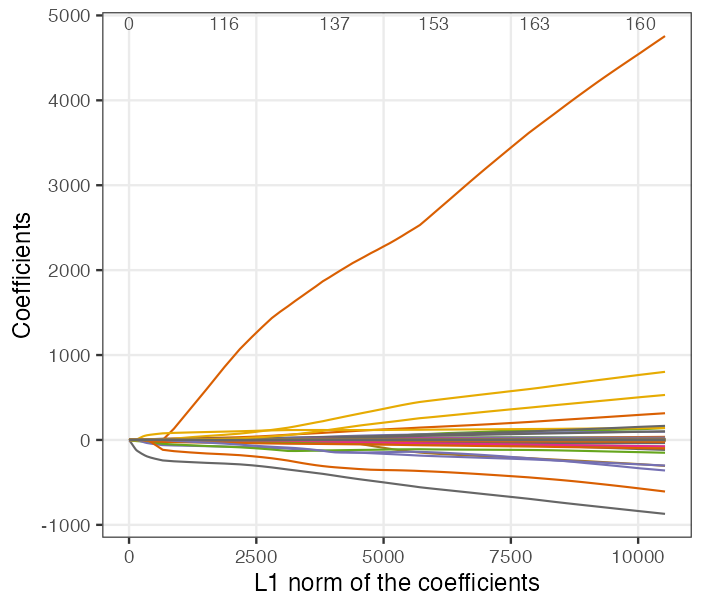
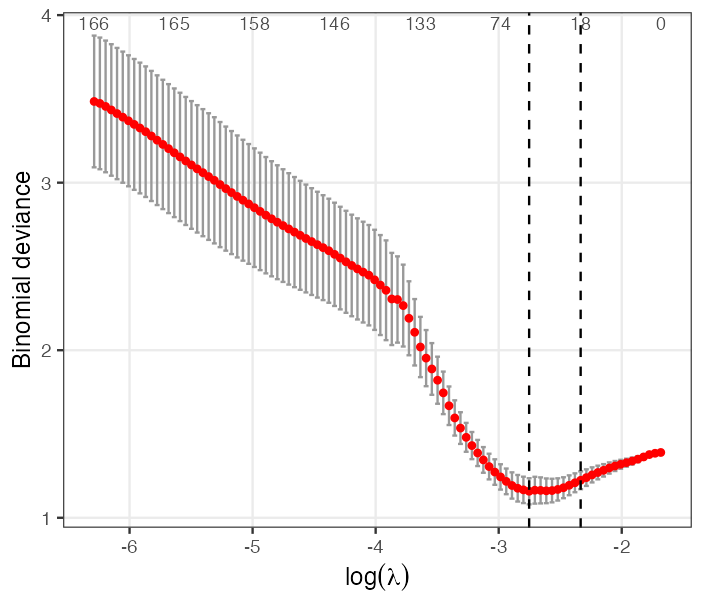
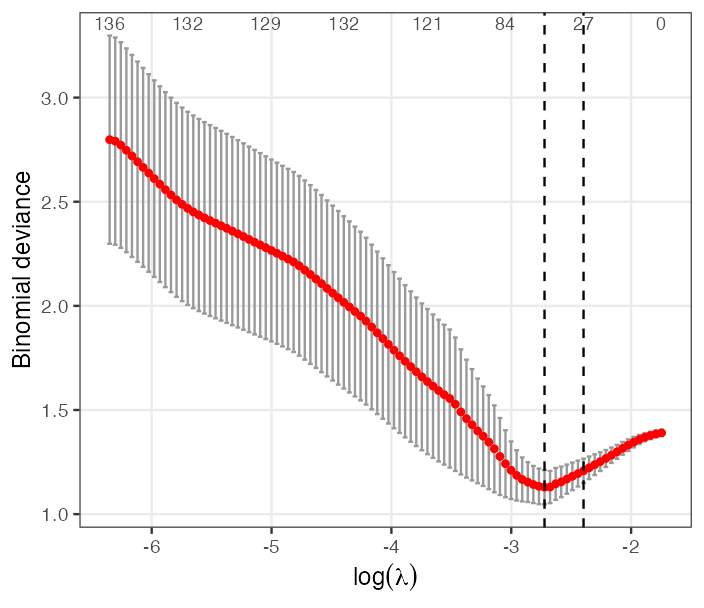
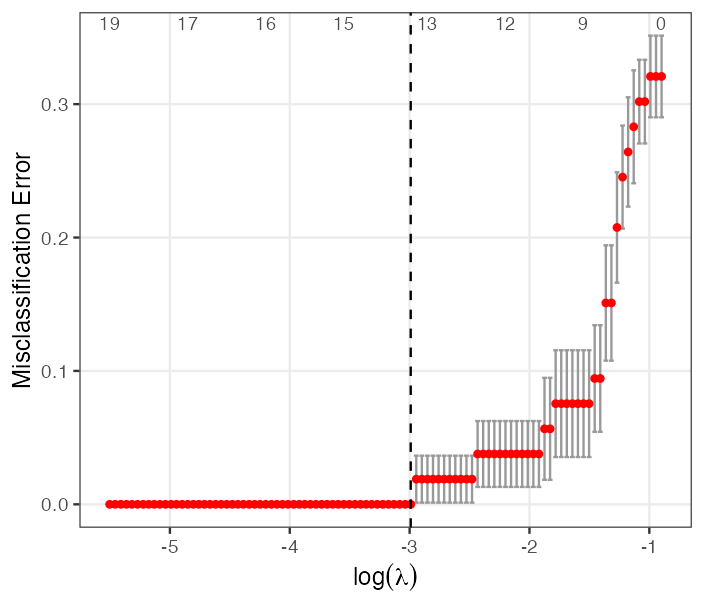
Figures: ch12_supervised_learning.R · Notes: Supervised Learning
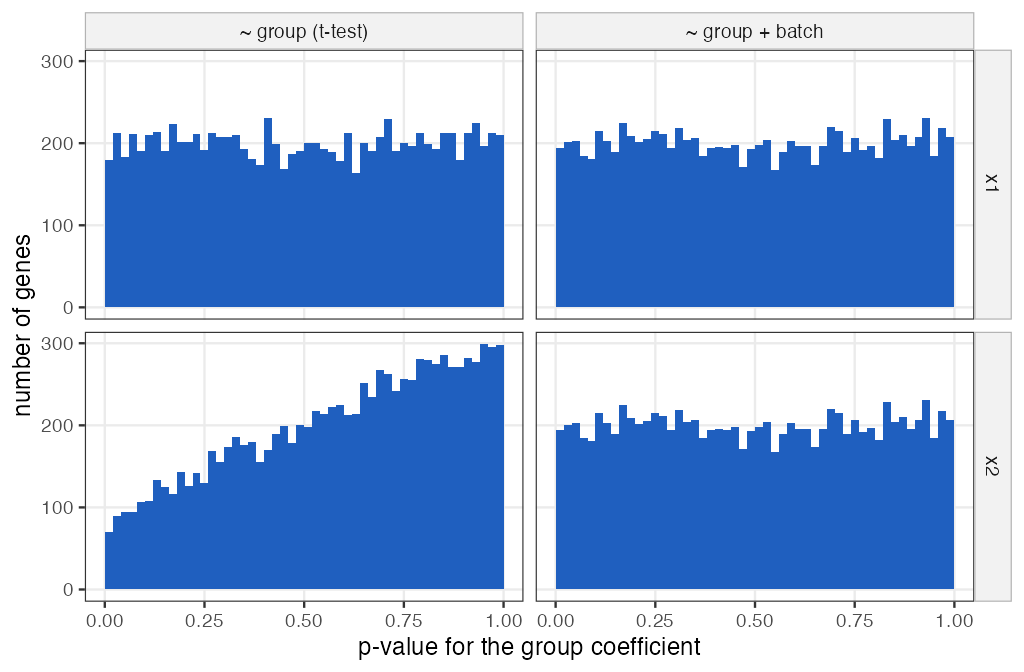
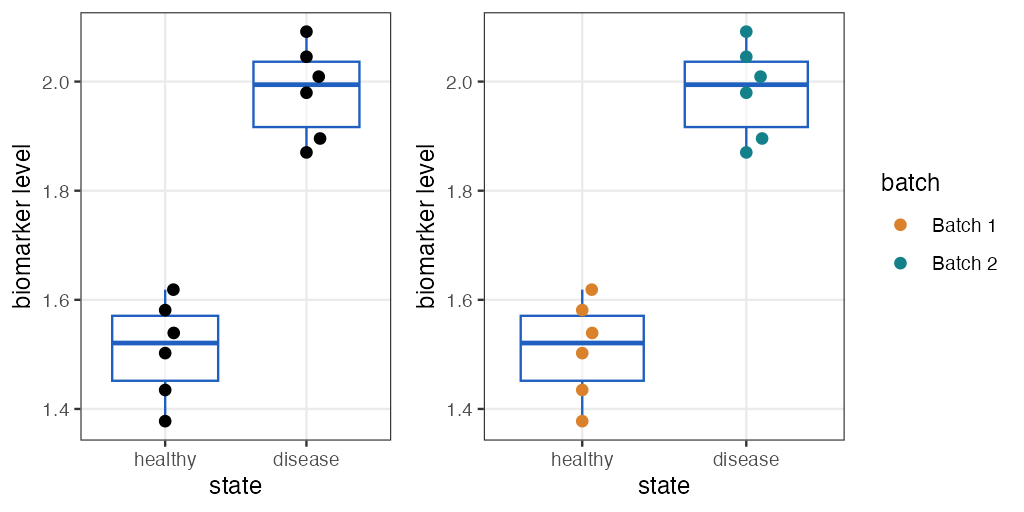
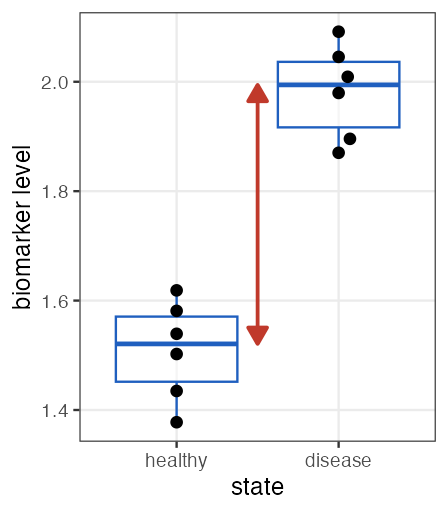
Figures: ch13_experimental_design.R · Notes: Design of High Throughput Experiments and their Analyses